Research Article: Journal of Drug and Alcohol Research (2022) Volume 11, Issue 8
Stability-Indicating HPLC Method for Simultaneous Determination of Drugs Nivolumab And Ipilimumab
Sharmila Alladi1*, Konda Ravi Kumar2 and B. Mallikarjuna32Department of Pharmaceutical Chemistry, Hindu College of Pharmacy, India
3Department of Chemistry, Government College, India
Sharmila Alladi, Department of Pharmacy, Jawaharlal Nehru Technological University Kakinada, India, Email: sharmisssree@gmail.com
Received: 03-Aug-2022, Manuscript No. jdar-22-70695; Editor assigned: 05-Aug-2022, Pre QC No. jdar-22-70695(PQ); Reviewed: 19-Aug-2022, QC No. jdar-22-70695; Revised: 24-Aug-2022, Manuscript No. jdar-22-70695 (R); Published: 31-Aug-2022, DOI: 10.4303/jdar/236194
Abstract
A simple, accurate, specific and rugged reverse phase liquid chromatographic method was developed for the simultaneous estimation of Nivolumab and Ipilimumab in bulk and tablet dosage form. A RP Inertsil ODS, having dimensions of 150 × 4.6 mm and particle size of 3.5 μ in isocratic mode, with mobile phase containing a mixture of 0.1% orthophosphoric acid and acetonitrile in the proportion (50:50 v/v). The mobile phase was pumped at a flow rate of 1.0 ml/min and the eluent were monitored at 225 nm.
Keywords
Inertsil ODS; Isocratic; Nivolumab and Ipilimumab
Introduction
Nivolumab, marketed as Opdivo, is a medication used to treat cancer [1]. Nivolumab is a monoclonal humanized IgG4 isotype antibody (kappa isotype) approved or under development in many onco-hematological cancers. It targets the programmed cell death-1 (PD-1) receptors of lymphocytes and thereby allowing the immune system to eliminate cancer cells [2]. It is used as a first line treatment for inoperable or metastatic melanoma [3] in combination with ipilimumab [4] if the cancer does not have a mutation [5] in BRAF, as a second line treatment following treatment with ipilimumab and if the cancer has a mutation in BRAF, with a BRAF inhibitor [6], as a second line treatment for squamous non-small lung cancer, and as a second line treatment for renal cell carcinoma. It had not been tested in pregnant women but based on the mechanism of action and animal studies, is probably toxic to the fetus [7]; it is not known if it is secreted in breast milk. Side effects include severe immune related inflammation of the lungs, colon, liver, kidneys, and thyroid and there are effects on skin, central nervous system, the heart and the digestive system (Figure 1).
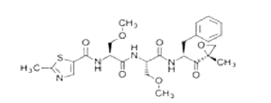
Figure 1: Chemical structure of Nivolumab
Ipilimumab is the first US FDA approved immune checkpoint blocking antibody drug to harness the patient’s own immune cells. One of the post marketing requirements is to develop a cell based neutralizing antibody assay 8]. Here, we share some of the most challenging aspects encountered during the assay development: new cell line construction; an unexpected inhibition of T-cell activation by low concentrations of ipilimumab and two issues caused by sample pretreatment with acid dissociation to overcome drug interference: instability of neutralizing antibody positive control at low pH, and incompatibility of commonly used acid dissociation buffers in the cell assay [9]. After troubleshooting and optimization, we successfully validated the assay and used the assay to test clinical samples to date (Figure 2).
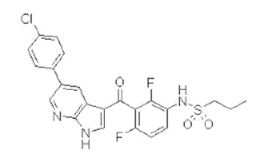
Figure 2: Chemical structure of Ipilimumab
Materials and Methods
Instrumentation
To develop a high performance liquid chromatographic method for simultaneous estimation of Nivolumab and Ipilimumab using Shimadzu (LC 20 AT VP) HPLC system on Inertsil ODS (150×4.6 mm ID, 3.5 μm particle size) column was used. The instrument is equipped with an auto sampler and UV-Visible detector. A 10 μl rheodyne injector port was used for injecting the samples. Data was analyzed by using Spin chrome software. A Global digital pH meter was used for pH measurements.
Chemicals and solvents
The working standards of Nivolumab and Ipilimumab were provided as gift samples from Chandra Labs, Hyderabad, India. HPLC grade water, orthophosphoric acid and acetonitrile were purchased from E.Merck (India) Ltd., Mumbai, India.
Chromatographic conditions
Acetonitrile and 0.1% orthophosphoric acid (50:50, v/v) was found to be the most suitable mobile phase for ideal chromatographic separation for simultaneous estimation of Nivolumab and Ipilimumab. The solvent mixture was filtered through 0.45 μm membrane filter and sonicated before use. It was pumped through the column at a flow rate of 1.0 ml/min. Injection volume was 10 μl and the column was maintained at a temperature of 27°C. The column was equilibrated by pumping the mobile phase through the column for at least 30 minutes prior to the injection of the drug solution. The detection of the drug was monitored at 225 nm. The run time was set as 8 minutes.
Preparation of buffer
1 ml OPA was measured and make the final volume to 1 lt with HPLC grade water.
Preparation of mobile phase
Mix acetonitrile and buffer in the ratio of 50:50, v/v. Filtered the solution through 0.45 μm membrane filter paper to remove all fine particles and gases. The mobile phase was sonicated for 10 min to remove gases.
Preparation of standard solution
Weigh accurately 100 mg of Nivolumab and 50 mg Ipilimumab working standards are taken into 100 ml volumetric flask add 70 ml of diluent, sonicate for 10 min to dissolve the contents make upto the mark with diluent. Further dilute 5 ml of above solution to 50 ml volumetric flask with diluent.
Preparation of sample solution
Weigh 100 mg of Nivolumab sample and 50 mg of Ipilimumab sample and transferred into a 100 ml volumetric flask. Add 70 ml of diluents sonicate for 15 min to dissolve the contents, diluted volume with diluent. Further diluted 5 ml of above solution to 50 ml volumetric flask make up with diluent.
Procedure
The column was maintained at a temperature of 27°C. The run time was set at 8 minutes. The column was equilibrated by pumping the mobile phase through the column for at least 30 minutes prior to the injection of the drug solutions. Inject 10 μl of the standard and sample solutions six times into the chromatographic system at a flow rate of 1.0 ml/ min and the corresponding chromatograms were obtained. From these chromatograms, the average area under the peak of each dilution was computed (Figure 3).
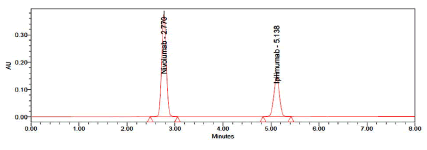
Figure 3: Typical chromatogram of standard for Nivolumab and Ipilimumab
Method validation
Linearity: Several aliquots of standard solutions of Nivolumab and Ipilimumab were taken in six different 10 ml volumetric flasks and diluted up to the mark with diluent such that the final concentrations were in the range of 25-150 μg/ml for Nivolumab and 12.5-75 μg/ml for Ipilimumab. The above solutions were injected into the HPLC system keeping the injection volume constant. The drugs were eluted with UV detector at 225 nm, peak areas was recorded for all the peaks. The linearity curves were constructed by plotting concentration of the drugs against peak areas. The regression equation of this curve was computed. This regression equation was later used to estimate the amount of drugs in tablet dosage forms (Figure 4).
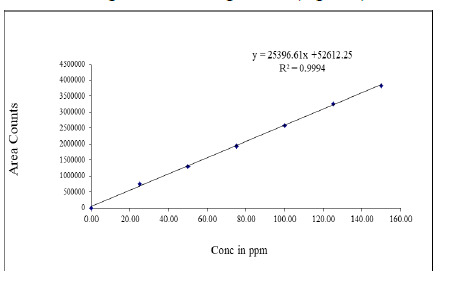
Figure 4: Linearity graph of Nivolumab
Precision: Precision for Nivolumab and Ipilimumab was determined in terms of intra-day precision and inter-day precision. Every sample was injected three times. The measurements for peak areas were expressed in terms of %RSD.
Accuracy
The accuracy of the method was assessed by recovery studies of Nivolumab and Ipilimumab at three concentration levels 50%, 100% and 150%. Fixed amount of pre-analyzed sample was spiked with known amount of Nivolumab and Ipilimumab. Each level was repeated three times. The %Recovery of Nivolumab and Ipilimumab were calculated.
System suitability
The system suitability parameters like retention time, theoretical plates and tailing factor were evaluated by six replicate analyses of Nivolumab and Ipilimumab and compared with standard values. The acceptance criteria are %RSD of peak areas not more than 2%, theoretical plates numbers (N) at least 2000 per each peak and tailing factors not more than 2.0 for Nivolumab and Ipilimumab.
Limit of detection and limit of quantification
The Limit of Detection (LOD) and Limit of Quantification (LOQ) of the developed method were determined by injecting progressively low concentrations of the standard solutions of Nivolumab and Ipilimumab using the developed HPLC method. LOD and LOQ were estimated from signal to noise ratio. LOD and LOQ were calculated using 3.3 σ/s and 10 σ/s formulae, respectively. Where, σ is the standard deviation of the peak areas and S is the slope of the corresponding calibration curve.
Robustness
The robustness of the method was determined by making small deliberate changes in method like variation of flow rate, mobile phase ratio and temperature.
Solution stability
Changes in the area response of the test material will be monitored throughout the validation. Each solution stability solution shall be injected after 6 hours and 24 hours.
Results and Discussion
The HPLC procedure was optimized with a view to develop an accurate, precise and reproducible method for simultaneous estimation of Nivolumab and Ipilimumab in tablet dosage form using Shimadzu (LC 20 AT VP) HPLC system on Inertsil ODS (150 × 4.6 mm ID, 3.5 μm particle size) column in isocratic mode with mobile phase composition acetonitrile and 0.1% OPA (50:50, v/v) resulted in peak with maximum separation, good shape and resolution. Flow rates between 0.8 to 1.2 ml/min were studied. A flow rate of 1.0 ml/min gave an optimum signal to noise ratio with reasonable separation time, the retention times for Nivolumab and Ipilimumab were found to be 2.770 minutes and 5.118 minutes respectively. Total run time was 8 minutes. The drug components were measured with UV detector at 225 nm. The results of optimized chromatographic conditions were shown in Table 1. The chromatograms were checked for appearance of any extra peaks under optimized conditions, showing no interference from common tablet excipients and impurities. Also, the peak areas were compared with standard and were found to be within limits. As shown in chromatogram, two analytes are eluted by forming symmetrical peaks. The typical chromatogram of Albendazole and Praziquental standard were shown in Figure 1. Linearity was obtained in the range of 25-150 μg/ ml for Nivolumab and 12.5-75 μg/ml for Ipilimumab. The correlation coefficient (r2) was found to be 0.999 for both Nivolumab and Ipilimumab respectively. The regression equation of the linearity plot of concentration of Nivolumab over its peak area was found to be y=25396.61x+52612.25, where x is the concentration of Nivolumab (μg/ml) and y is the corresponding peak area. The regression equation of the linearity plot of concentration of Ipilimumab over its peak area was found to be y=24143.40x+651.61, where x is the concentration of Ipilimumab (μg/ml) and y is the corresponding peak area. The results show that an excellent correlation exists between peak area and concentration of drugs within the concentration range indicated. The linearity results were shown in Tables 2 and 3 and the calibration curves were shown in Figures 3 and 4. The %RSD for system, method and intermediate precision for Nivolumab and Ipilimumab were found to be within the limits (limit %RSD<2.0%) and hence the method is precise. The precision data of Nivolumab and Ipilimumab were furnished in Table 4. The %Recovery of the drugs Nivolumab and Ipilimumab were found to be 99.4 to 100% and 100.5 to 100.7% respectively and the high percentage of recovery of Nivolumab and Ipilimumab indicates that the proposed method is highly accurate. The results of accuracy studies of Nivolumab and Ipilimumab were shown in Table 5. The robustness studies indicated that no considerable effect on the determination of the drugs. Therefore, the test method is robust for the quantification of the drugs. In all deliberately varied conditions, the % RSD for replicate injections of Nivolumab and Ipilimumab were found to be within the acceptable limits. The results of robustness studies of Nivolumab and Ipilimumab were shown in Table 6. The stability studies i.e., changes in the area response of the test material will be monitored throughout the validation. Each solution stability solution shall be injected after 6 hours and 24 hours. The results of the stability studies were shown in Table 7.
| S. No. | Parameter | Condition |
|---|---|---|
| 1 | Mobile phase | Acetonitrile and 0.1% OPA 50:50, v/v |
| 2 | Column | Inertsil ODS (150×4.6 mm, 3.5 µm) |
| 3 | Column temperature | 27˚C |
| 4 | Wave length | 225 nm |
| 5 | Injection volume | 10 µL |
| 6 | Flow rate | 1.0 mL/min. |
| 7 | Run time | 8 min. |
Table 1: Optimized chromatographic conditions
| Inj | Std Area |
|---|---|
| 1 | 2520286 |
| 2 | 2513277 |
| 3 | 2520624 |
| 4 | 2518056 |
| 5 | 2511947 |
| 6 | 2518119 |
| mean | 2517052 |
| SD | 3624.254 |
| % RSD | 0.14 |
Table 2: Linearity studies of Nivolumab
| Inj | Std Area |
|---|---|
| 1 | 1195540 |
| 2 | 1192520 |
| 3 | 1203847 |
| 4 | 1196328 |
| 5 | 1203809 |
| 6 | 1202728 |
| mean | 1199129 |
| SD | 4929.911 |
| % RSD | 0.41 |
Table 3: Linearity studies of Ipilimumab
| S. No. | Area of Nivolumab | Area of Ipilimumab | |
|---|---|---|---|
| System Precision | 1 | 2520286 | 1195540 |
| 2 | 2513277 | 1192520 | |
| 3 | 2520624 | 1203847 | |
| 4 | 2518056 | 1196328 | |
| 5 | 2511947 | 1203809 | |
| 6 | 2518119 | 1202728 | |
| Mean | 2517052 | 1199129 | |
| SD | 3624.25 | 4929.91 | |
| % RSD | 0.144 | 0.411 | |
| Method Precision | 1 | 2501286 | 1195977 |
| 2 | 2536871 | 1206574 | |
| 3 | 2512783 | 1187354 | |
| 4 | 2562874 | 1204856 | |
| 5 | 2527136 | 1215669 | |
| 6 | 2486784 | 1198983 | |
| Mean | 100.2 | 100.2 | |
| SD | 1.069 | 0.827 | |
| % RSD | 1.07 | 0.83 | |
| Intermediate precision | 1 | 2513125 | 1215379 |
| 2 | 2515871 | 1182559 | |
| 3 | 2502154 | 1206358 | |
| 4 | 2536245 | 1184652 | |
| 5 | 2481871 | 1211768 | |
| 6 | 2547652 | 1203883 | |
| Mean | 100 | 100.2 | |
| SD | 0.939 | 1.143 | |
| % RSD | 0.94 | 1.14 | |
Table 4: Precision data of Nivolumab and Ipilimumab
| % Concentration level |
Nivolumab | Ipilimumab | ||||
|---|---|---|---|---|---|---|
| Conc. added (μg/mL) |
Conc. found (μg/mL) |
% Recovery | Conc. added (μg/mL) |
Conc. found (μg/mL) |
% Recovery | |
| 50% | 50 | 49.72 | 99.4 | 25 | 25.18 | 100.7 |
| 100% | 100 | 99.87 | 99.9 | 50 | 50.34 | 100.7 |
| 150% | 150 | 149.97 | 100.0 | 75 | 75.36 | 100.5 |
Table 5: Accuracy studies of Nivolumab and Ipilimumab
| S. No. | Condition | %RSD of Nivolumab | %RSD of Ipilimumab |
|---|---|---|---|
| 1 | Flow rate (-) | 0.86 | 1.01 |
| 2 | Flow rate (+) | 0.8 | 1.12 |
| 3 | Mobile phase (-) | 0.73 | 0.78 |
| 4 | Mobile phase (+) | 1.15 | 1.46 |
| 5 | Temperature (-) | 1.5 | 0.6 |
| 6 | Temperature (+) | 1.43 | 0.56 |
Table 6: Robustness data for Nivolumab and Ipilimumab
| Time in Hrs. | Nivolumab | Ipilimumab | Resolution |
|---|---|---|---|
| INITIAL | 2516472 | 1198154 | 11.83 |
| 6 Hrs | 2510374 | 1195587 | 11.86 |
| 12 Hrs | 2502481 | 1192046 | 11.91 |
| 18 Hrs | 2497210 | 1191533 | 11.93 |
| 24 Hrs | 2492023 | 1185124 | 11.76 |
Table 7: Solution Stability data
Conclusion
The developed method was validated in terms of accuracy, Linearity and precision. A good linear relationship was observed for Nivolumab and Ipilimumab in the concentration ranges of 25–150 μg/mL for Nivolumab and 12.5-75 μg/mL for Ipilimumab. The correlation coefficient for Nivolumab and Ipilimumab was found to be 0.999. Selectivity experiment showed that there is no interference or overlapping of the peaks either due to diluents with the main peak of Nivolumab and Ipilimumab.
The percentage RSD for precision is <2 which confirms that method is sufficiently precise and the total runtime required for the method is only 8 mins for eluting both Nivolumab and Ipilimumab. The proposed method is simple, fast, accurate, and precise and can be used for routine analysis in quality control of Nivolumab and Ipilimumab.
Source of Support
None.
Conflict of Interest
Nil.
References
- J. Ferlay, I. Soerjomataram, R. Dikshit, Cancer incidence and mortality worldwide: Sources, methods and major patterns in GLOBOCAN, Int J Cancer, 5(2015), 136.
- C. Fitzmaurice, C. Allen, R. Barber, L. Barregard, Z. Bhutta, Global, regional, and national cancer incidence, mortality, years of life lost, years lived with disability, and disability-adjusted life-years for 32 cancer groups, 1990 to 2015: A systematic analysis for the global burden of disease study, JAMA Oncol, 4(2017), 524–548.
- J. Pignon, A. le Maître, E. Maillard, J. Bourhis, Meta-analysis of chemotherapy in head and neck cancer (MACH-NC): An update on 93 randomised trials and 17,346 patients, J Radir Oncol, 92(2009), 4–14.
- D. Adelstein, M. L. Gillison, D. G. Pfister, NCCN guidelines insights: Head and neck cancers, J Natl Compr Canc Netw, 15(2017), 761–770.
- R.L. Ferris, G. Blumenschein, J. Fayette, Nivolumab for recurrent squamous-cell carcinoma of the head and neck, N Engl J Med, 19(2016), 1856–1867.
- Y. Shih, L.S. Elting, A.L. Pavluck, A. Stewart, M.T. Halpern, Immunotherapy in the initial treatment of newly diagnosed cancer patients: Utilization trend and cost projections, J Cancer Invest, 28(2010), 46–53.
- D.M. Geynisman, C.R. Chien, F. Smieliauskas, C. Shen, Y. Shih, Economic evaluation of therapeutic cancer vaccines and immunotherapy: A systematic review, Hum Vaccin Immunother, 11(2014), 3415–3424.
- M.D. Hellmann, M.K. Callaha, M.M Awad, E. Calvo, P.A. Ascierto, et al., Tumor mutational burden and efficacy of nivolumab monotherapy and in combination with ipilimumab in small-cell lung cancer, J Cancer cell, 35(2019), 853–861.
- F.S. Hodi, V. Chiarion-Sileni, R. Gonzalez Grub, P. Rutkowski, C.L. Cowey, et al., Nivolumab plus ipilimumab or nivolumab alone versus ipilimumab alone in advanced melanoma (CheckMate 067): 4-year outcomes of a multicentre, randomised, phase 3 trial, The Lancet Oncology, 11(2018), 1480–1492.
Citation: © 2022 Anna Ehrnrooth, et al. This is an open access article distributed under the terms of the Creative Commons Attribution License, which permits unrestricted use, distribution, and reproduction in any medium, provided the original work is properly cited.

