Research Article: Journal of Drug and Alcohol Research (2022) Volume 11, Issue 11
An In-silico Study for Available Microarray Datasets Analysis for Tropheryma whipplei to Evaluate Impact of Drug and Thermic Stress
Amit Joshi1 and Vikas Kaushik2*2Department of Bioinformatics, University of Sadat City, Egypt
Vikas Kaushik, Department of Bioinformatics, University of Sadat City, Egypt, Email: vikas31bt@gmail.com
Received: 01-Nov-2022, Manuscript No. JDAR-22-82117; Editor assigned: 03-Nov-2022, Pre QC No. JDAR-22-82117 (PQ); Reviewed: 17-Nov-2022, QC No. JDAR-22-82117; Revised: 22-Nov-2022, Manuscript No. JDAR-22-82117 (R); Published: 29-Nov-2022, DOI: 10.4303/JDAR/236206
Abstract
Tropheryma whipplei is a Gram-positive rod-shaped bacteria, a member of the Actinobacteria division that causes Whipple’s disease. This disease is very harmful as it can cause multiple organ failure including lipodystrophy of intestine and central nervous system functionality. Therefore this study was found crucial for identification of genes that are affected within T. whipplei due to temperature and commonly used drug Doxycycline. This will assist in future drug repurposing against the bacterium. The Gene expression profiling analysis was performed using GEO2R that compares two or more groups of samples in order to identify genes that are differentially expressed across experimental conditions. Force normalization which uses quantile normalization was applied for the array normalization to the expression data making all selected samples have identical value distribution. Limma package was used for the p value calculation between different groups. The study on the series GSE5717 shows that higher doses of Doxycycline drug treatments on the bacterium T. whipplei does not have much impact, as bacterium survival strategies also enhances both directly and indirectly. Therefore, the search for new drug or novel vaccine candidate research by in-silico mode is required for rapid development of treatment. While analyzing the series GSE3693, it was found that thermic stress on bacterium can activate bacterium survival genetic makeup. Our findings suggest that T. whipplei has a distinct adaptive control to thermal stressors, which is consistent with its presumed environment origins. Also, it was found that higher concentration of Doxycycline, up-regulation of membrane proteins like ATP Binding cassette transporters, which may create export and detoxify systems by which T. whipplei may restrict the impact of the bactericidal chemical.
Keywords
Microarray analysis; Tropheryma whipplei; Doxycycline; Thermic stress; GEO-2R tool
Introduction
Tropheryma whipplei is a Gram-positive rod-shaped bacteria, a member of the Actinobacteria division. Whipple’s diseases commonly cause gasteroenteritis and endocarditis as major problems in patients [1]. T. whipplei is exclusively found in humans, and it spreads through the oral–oral and oral–fecal channels. Once a patient’s immune system has responded to the first encounter, the bacteria can be retained by the patient for a long time, enabling it to proliferate throughout the population [2]. This bacterium targets macrophages, as well as many other vital sites including eyes, skin, intestine, circulatory system and central nervous system [3].
The tiny, hairlike protrusion (villi) on the walls of our intestinal tract assist your body absorb nutrients. Whipple illness destroys the villi, making it difficult to absorb nutrients. In persons with Whipple illness, nutrient deficiencies are widespread, and they can cause fatigue, weakness, body weight loss, and joint discomfort. Whipple disease is a condition that progresses and can be deadly. Despite the fact that the illness is uncommon, fatalities have been documented as a result of it. The progression of the disease to the brain, which can inflict irreparable damage, is a leading cause of mortality. The bacteria T. whipplei causes Whipple’s disease, which is a multisystemic infectious illness. Arthralgia, calorie restriction, and dysentery are common symptoms of the condition. Years before gastrointestinal symptoms appear, joint involvement is common. T. whipplei can cause localised joint infections without gas trointestinal impact, in addition to systemic signs (“typical Whipple’s illness”). Articular symptoms of T. whipplei infections, including systemic and localised, are frequently mistaken as signs of autoimmunity arthritis [4].
Only two medications have been found to be extensively discussed in available literature i.e. Doxycycline and Hydroxychloroquine, although still no proper diagnostics is available for T. whipplei [5]. Recently, few successful immunoinformatics studies were conducted to develop vaccine candidate against T. whipplei [6,7]. In this study we analysed available microarray data from Geo-data sets GSE3693, GSE5717 that shows impact of temperature and drug (Doxycycline) on the expression of genes in the bacterialgenomic domain. Our study assisted in identifying the various bacterial genes involved in the stress tolerance. In Figure 1 work flow for the microarray analysis provided.
Methodology
Differential gene expression analysis (Microarray GEO datasets)
The Gene expression profiling analysis was performed using GEO2R whichcompares two or more groups of samples in order to identify genes that are differentially expressed across experimental conditions. Force normalization was applied for the array normalization which usesquantile normalization to the expression data making all selected samples has identical value distribution. Limma package was used for the p-value calculation between different groups. The Benjamini and Hochberg false discovery rate method was selected by default which is the most commonly used adjustment for microarray data and provides a good balance between discovery of statistically significant genes and limitation of false positives [8] (Figure 1).
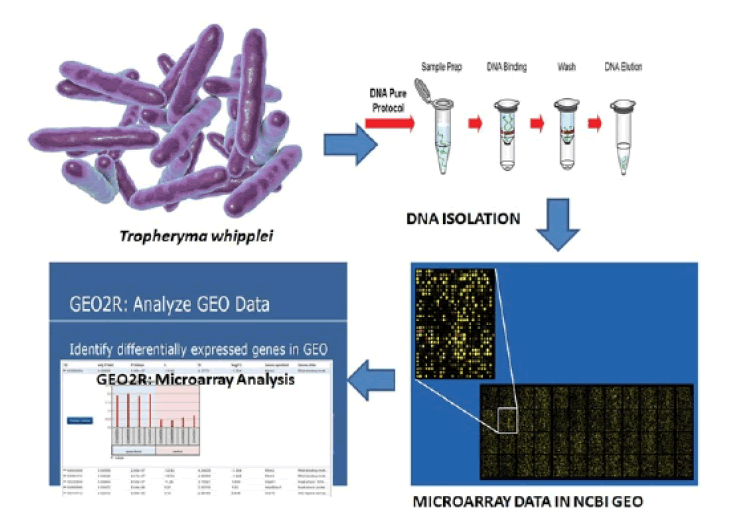
Figure 1: Workflow of microarray analysis.
The differential expression was calculated based on biological analysis plan. The significant differentially expressed genes were filtered with less than or equal to p ≤ 0.05. Up-regulated genes ≥ 1-fold change and downregulated genes ≤ -1-fold change were applied for significant twofold difference in treated vs control [9].
Plots interpretation
The participants were adolescents. The population may have been investigated in schools, hospitals, or socio-demographic surveys.
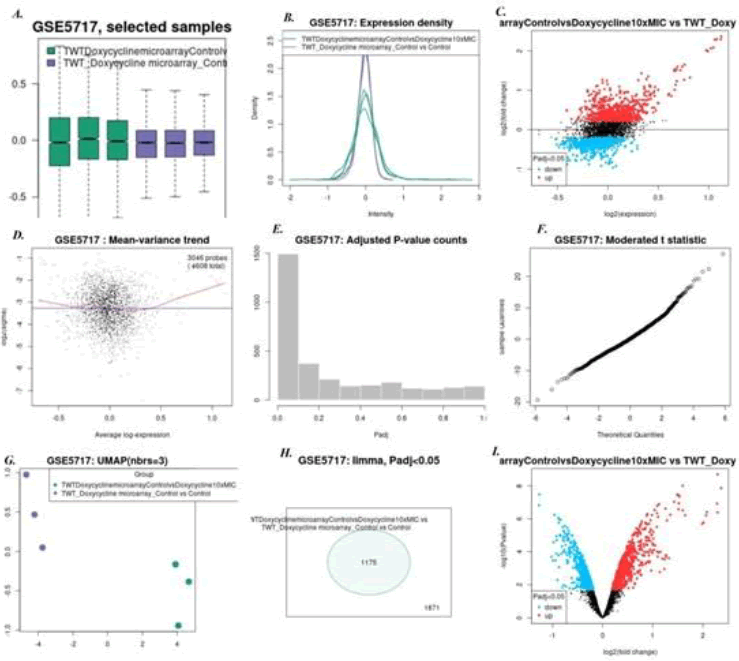
Volcano plot: A volcano plot displays statistical significance (-log10 P value) versus magnitude of change (log2 fold change) and is useful for visualizing differentially expressed genes. Highlighted genes are significantly differentially expressed at a default adjusted p-value cutoff of 0.05 (red=upregulated, blue=downregulated). A volcano plot displays the test results for a single contrast (a contrast is one sample group compared to another sample group). Volcano plot were generated using Limma (volcanoplot) [10].
Mean Difference (MD) plot: A mean difference (MD) plot displays log2 fold change versus average log2 expression values and is useful for visualizing differentially expressed genes. They are similar to volcano plot. Highlighted genes are significantly differentially expressed at a default adjusted p-value cut off of 0.05 (red=upregulated, blue=downregulated). A mean difference plot displays the test results for a single contrast (a contrast is one Sample group compared to another sample group). Mean difference (MD) plot was generated using Limma (plotMD) [11].
UMAP: Uniform Manifold Approximation and Projection (UMAP) is a dimension reduction technique useful for visualizing how samples are related to each other. The number of nearest neighbors used in the calculation is indicated in the plot. UMAP were generated using umap [12].
Boxplot: Boxplot is used to view the distribution of the values of the selected samples. The samples are colored according to groups. Viewing the distribution can be useful for determining if your selected samples are suitable for differential expression analysis. Median-centered values are indicative that the data are normalized and cross-comparable. The plot shows data after log transform and normalization. It is generated using R boxplot [13].
Expression density: Expression density is used to view the distribution of the values of the selected Samples. The samples are colored according to groups. This plot complements boxplot in checking for data normalization before differential expression analysis. The plot shows data after log transform and normalization. It is generated using R plot Densities [14].
Adjusted P-value histogram: Adjusted P-value histogram is used to view the distribution of the P-values in the analysis results. The P-value here is the same as in the Top differentially expressed genes table and computed using all selected contrasts. It is generated using R hist [15].
Moderated t-statistic quantile-quantile (q-q) plot: Moderated t-statistic quantile-quantile plot is the quantiles of a data sample against the theoretical quantiles of a student’s t distribution. This plot helps to assess the quality of the Limma test results. Ideally, the points should lie along a straight line, meaning that the values for moderated t-statistic computed during the test follow their theoretically predicted distribution. It is generated using R limma (qqt) [16].
Mean variance trend: Mean Variance trend plot is used to check the mean-variance relationship of the expression data, after fitting a linear model. It can help show if there is a lot of variation in the data. This plot can help assess whether applying the precision weights option to take mean-variance trend into account is recommended. Precision weights improve accuracy of test results when a strong mean-variance trend is present. The plot does not require group selection. Each point represents a gene. The red line is mean-variance trend approximation that can be taken into account during differential gene expression analysis. The blue line is constant variance approximation. It is generated using R limma (plotSA, vooma) [17].
Venn diagram: Mathematical set based representation plot, it represents number of genes group wise.
Microarray analysis was conducted by using GEO-2R tool of NCBI, latest microarray analysis schemes that were constructed to study 2 Geoseries data that was retrieved from Geo-Datasets are represented in Table 1.
| Geoseries Accession | Number of sample | Organism name | Detailed Interpretetation of Experiment | Groups Designed for Biological analysis | Source |
|---|---|---|---|---|---|
| GSE3693 | 6 | T.whipplei | Transcriptromic analysis of Tropheryma whipplei in response to temperature stress | 3 | Crapoulet et al., 2006 |
| GSE5717 | 9 | T.whipplei | Susceptibility of drug doxycycline was checked on Tropheryma whipplei at 0.5 mg and 5mg concentration by microarray experiments | 2 | Van La et al., 2007 |
Table 1: List of microarray experiments accessed from NCBI Geo-Datasets for microarray analysis.
Results
Biological analysis plan
Series data was retrieved from Geo-datasets NCBI database for bacterium T. whipplei. For the analysis two series were considered: GSE5717 and GSE3693. GSE3693 series shows microarray data for thermic stress on the bacterium, while GSE5717 series shows microarray data for drug stress (commonly used drug against the bacterium was found to be Doxycycline). For thermic stress, cold and heat shocks were given to bacterium and then microarray studies was conducted, while for Doxycycline treatment 0.5 mg/l (1x) concentration and 5 mg/l (10x) concentration were provided separately to the bacterium and later on microarray studies was conducted. To determine expression level changes in the bacterium gene functionality we followed basic plan presented in Table 2.
| Biological analysis plan for Series GSE5717 | ||
|---|---|---|
| Treated replicate Vs Control replicate | ||
| 1 x MIC Doxycycline (0.5 mg/L) Vs T. whipplei strain Twist | GSM133497 (TWT_Doxycyclinemicroarray_Control vs Doxycycline 1xMIC_rep1) | GSM133490 (TWT_Doxycyclinemicroarray_Control vs Control_rep1) |
| GSM133499 (TWT_Doxycyclinemicroarray_Control vs Doxycycline 1xMIC_rep2) | GSM133492 (TWT_Doxycyclinemicroarray_Control vs Control_rep2) | |
| GSM133501 (TWT_Doxycyclinemicroarray_Control vs Doxycycline 1xMIC_rep3) | GSM133495 (TWT_Doxycyclinemicroarray_Control vs Control_rep3) | |
| Treated replicate Vs Control replicate | ||
| 1xMIC Doxycycline (5 mg/L) Vs T. whipplei strain Twist | GSM133503 (TWT_Doxycyclinemicroarray_Control vs Doxycycline 10xMIC_rep1) | GSM133490 (TWT_Doxycyclinemicroarray_Control vs Control_rep1) |
| GSM133506 (TWT_Doxycyclinemicroarray_Control vs Doxycycline 10xMIC_rep2) | GSM133492 (TWT_Doxycyclinemicroarray_Control vs Control_rep2) | |
| GSM133508 (TWT_Doxycyclinemicroarray_Control vs Doxycycline 10xMIC_rep3) | GSM133495 (TWT_Doxycyclinemicroarray_Control vs Control_rep3) | |
| Biological analysis plan for series GSE3693 | ||
| Treated replicate Vs Control replicate | ||
| Cold shock at Tempearture 40C Vs 370C | GSM85351 (TWT Temperature 4 vs Ref_rep1) | GSM85348 (TWT Temperature 37 vs Ref_rep1) |
| GSM85352 (TWT Temperature 4 vs Ref_rep2) | GSM85349 (TWT Temperature 37 vs Ref_rep2) | |
| GSM85353 (TWT Temperature 4 vs Ref_rep3) | GSM85350 (TWT Temperature 37 vs Ref_rep3) | |
| Treated replicate Vs Control replicate | ||
| Cold shock at Tempearture 280C Vs 370C | GSM85354 (TWT Temperature 28 vs Ref_rep1) | GSM85348 (TWT Temperature 37 vs Ref_rep1) |
| GSM85355 (TWT Temperature 28 vs Ref_rep2) | GSM85349 (TWT Temperature 37 vs Ref_rep2) | |
| GSM85356 (TWT Temperature 28 vs Ref_rep3) | GSM85350 (TWT Temperature 37 vs Ref_rep3) | |
| Treated replicate Vs Control replicate | ||
| Heat shock at Tempearture 430C Vs 370C | GSM85357 (TWT Temperature 43 vs Ref_rep1) | GSM85348 (TWT Temperature 37 vs Ref_rep1) |
| GSM85358 (TWT Temperature 43 vs Ref_rep2) | GSM85349 (TWT Temperature 37 vs Ref_rep2) | |
| GSM85359 (TWT Temperature 43 vs Ref_rep3) | GSM85350 (TWT Temperature 37 vs Ref_rep3) | |
Table 2: Biological analysis plan for series GSE5717 and GSE369.
Microarray data-series analysis
The interpretation and observation for both the GEO data- series have been provided here as follows:
a. GSE3693: For this series 3 groups were identified for bacterium on the basis of temperature treatment. T. whipplei genomic patterns in exposure to heat stressors revealed distinct transcription patterns, as per microarray analysis. The dnaK regulon, which includes grpE, hspR, dnaK, clpB, and cbpA, as well as the TWT745 ORF, that also translate for heat-shock polypeptide, were all up-regulated after at 43°C. RibC and IspDF proteins, which were thought to be virulent, were similarly up-regulated in heat shock. T. whipplei transcript was extensively changed after cold shock for 4°C, in comparison to the heat-shock activity. 9 regulons were discovered among the 149 genes differentially expressed, one of which was made up of five genes having ABC transporter commonalities that suggests enhanced uptake of nutrients. The overexpression of heatshock molecules such as GroEL2 and ClpP1, and also numerous genes associated with metabolism, was seen after T. whipplei in exposure to cold. These findings reveal that T. whipplei has a distinct adaptive control to thermal stressors, which is consistent with its presumed environment origins.
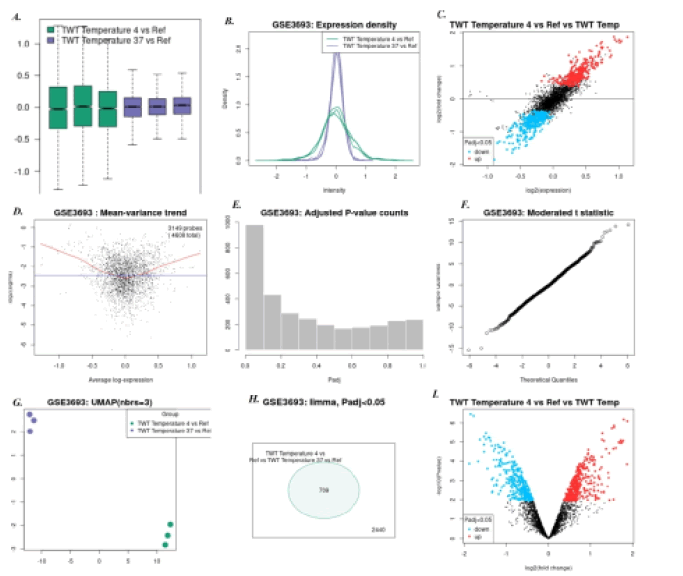
1. Cold shock temperature 4°C Vs 37°C: Here, 57 genes were found to be down regulated and 75 genes were found to be up regulated. The down regulated genes include peptidase, ribonuclease, deoxy ribonuclease and 3-dehydroquinate synthase; while up regulated genes include cell division protein fts-W, 4-aminobutyrate amino transferase gab-T, Chaperonin groEL and GlucokinaseglkA. Figure 2 shows all microarray analysis plots for this group.
Figure 2: Microarray analysis plots for group Cold shock temperature 4°C Vs 37°C under series GSE3693: A)Box-plot B) Expression density plot C) Mean difference plot D)Mean variance plot E) Adjusted P-value plot F) Moderated t-statistics plot G)UMAP H)Venn Diagram I) Volcano plot.
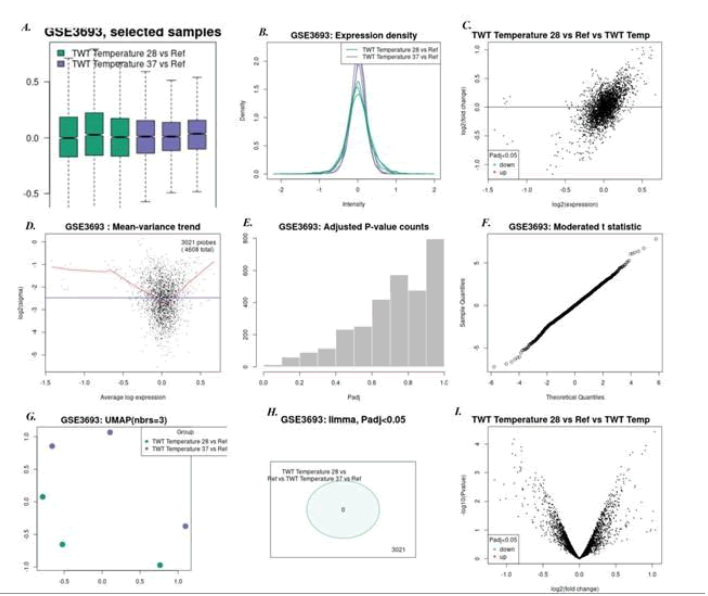
2. Cold shock temperature 28°C Vs 37°C: Here 4 genes were found to be down regulated and 3 genes were found to be up regulated. The down regulated gene was curved DNA binding protein (cbpA), and the significant up regulated gene was found to be 4-aminobutyrate amino transferase (gab-T). Figure 3 shows all microarray analysis plots for this group.
Figure 3: Microarray analysis plots for group Cold shock temperature 28°C Vs 37°C under series GSE3693:A)Box-plot B)Expression density plot C) Mean difference plot D)Mean variance plot E) Adjusted P-value plot F) Moderated t-statistics plot G)UMAP H)Venn Diagram I) Volcano plot.
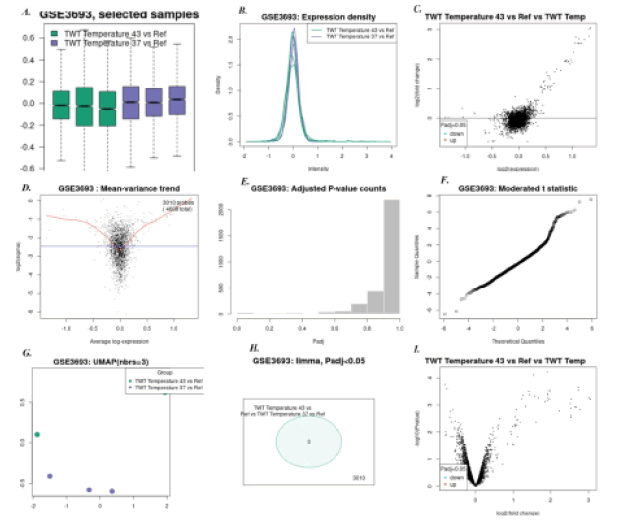
3. Heat shock temperature 43°C Vs 37°C: Here, 43 up regulated genes were found and no significant down regulated genes were found. Fe-ABC transporter gene, HSP-70 cofactor, cbpA gene, riboflavin synthase, and GTP cyclohydrolase-I was few common up-regulated genes. Figure 4 shows all microarray analysis plots for this group.
Figure 4: Mi ray analysis plots for group Heat shock temperature 43°C Vs 37°C under series GSE3693:A)Box-plot B)Expression density plot C) Mean difference plot D)Mean variance plot E) Adjusted P-value plot F) Moderated t-statistics plot G)UMAP H)Venn Diagram I) Volcano plot.
b. GSE5717: For this series two groups were identified, based on drug doxycycline treatment with varied proportions on bacterium T. whipplei. Using a whole-genome DNA microarray data, the susceptibility of T. whipplei to doxycycline was studied at the genetic expression level. Antibiotic related primary transcriptional patterns were observed when T. whipplei was exposed to a minimum inhibitory dosage of 0.5 mg doxycycline, but indirect effects were identified with a 5 mg dosage of doxycycline. At low doses of 0.5 mg translation inhibition of bacterial ribosome proteins and transcriptionfactors was observed, that can be linked with arrest of cellular growth. In higher concentration of Doxycycline, up-regulation of membrane proteins like ATP Binding cassette transporters, which may create export and detoxify systems by which T. whipplei may restrict the impact of the bactericidal chemical.
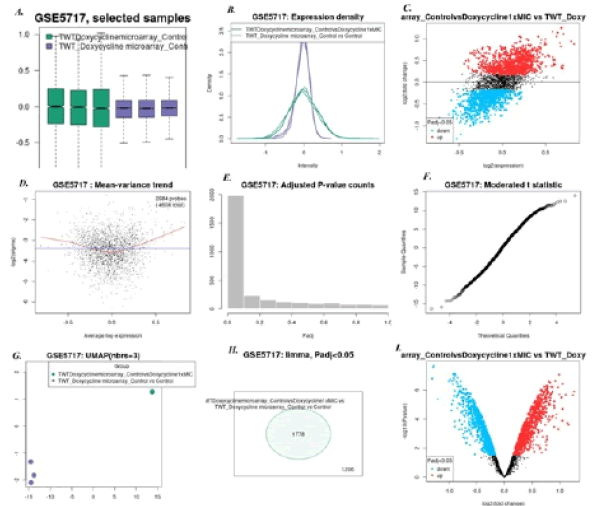
1. Doxycycline at 0.5 mg/l vs Tropheryma whipplei Twist strain: Here we found 9 genes (especially TWT685 gene that expresses DNA ribonuclease) to be up regulated while 4 genes to be down regulated (especially rpo-B gene that expresses DNA directed RNA-polymerase). Figure 5 shows all microarray analysis plots for this group.
Figure 5: Microarray analysis plots for group Doxycycline @ 0.5 mg/l vs Tropheryma whipplei Twist strain under series GSE5717 A)Box-plot B) Expression density plot C) Mean difference plot D)Mean variance plot E) Adjusted P-value plot F) Moderated t-statistics plot G)UMAP H)Venn Diagram I) Volcano plot.
2. Doxycycline 5 mg/l vs Tropheryma whipplei Twist strain: Here we found 42 genes were up regulated while 3 genes were down regulated. Thedown regulated genes include ribosomal protein genes. Up-regulated genes were protease, aminotransferase, and nucleotidyl transferases. Figure 6 shows all microarray analysis plots for this group.
Figure 6: Microarray analysis plots for group Doxycycline @ 5 mg/l vs Tropheryma whipplei Twist strain under series GSE5717: A)Box-plot B) Expression density plot C) Mean difference plot D)Mean variance plot E) Adjusted P-value plot F) Moderated t-statistics plot G)UMAP H)Venn Diagram I) Volcano plot.
Discussion
Tropheryma whipplei is a Gram-positive rod-shaped bacteria, a member of the Actinobacteria division that causes Whipple’s disease. This disease is very harmful as it can cause multiple organ system failure. In naturalistic environments, the most prevalent stress that almost all organisms face is thermal variation. Cold shock and heat shock reactions are complicated and particular mechanisms that microorganisms have evolved to withstand hazardous conditions that might be caused by severe temperature change [18]. In current study we found that T. whipplei adaptive reaction was marked by significant upregulation of many protein chaperones, including GrpE, HspR, DnaK, CbpA, and the ClpB protease, all of which are critical in most recognized microbes’ heat shock reactions. While T. whipplei does not have classical CSP (Cold shock protein), it does have various specialised adaptation mechanisms for reacting to cold [19]. The contradictory up-regulation of the GroEL2 transcript is the most noticeable aspect. At low temperatures, this transcript, which encodes a member of the HSP family, is likely to be down-regulated. While unusual, the hyperthermoacidophilic archaeon Sulfolobus shibatae, which can adapt to and live in harsh natural settings, has previously been shown to boost transcription of HSP60 genes at low temperatures [20]. Treatment of T. whipplei to the minimum inhibitory concentration of doxycycline was mostly characterised by up-regulation of multiple genes that encode ribosomal proteins, which is consistent with the antibiotic’s translational inhibitory action (rplM, rpsT, rpsG and rpsL). This boost in ribosome production capability is usually followed by an increase in rRNA transcription in order to restore protein production. As a result, both rpoA and rpoB were down-regulated in our experiments, exacerbating the doxycycline-induced protein synthesis deficiency [21]. Doxycycline treatment of T. whipplei affected fatty acid metabolism, as evidenced by reduced expression of kasA. The kas operon is involved in mycolic acid production, which is one of the most important components of mycobacterial cell walls.
Conclusion
From the analysis of the series GSE5717, it is quite evident that higher doses of Doxycycline drug treatments over the bacterium T. whipplei have not much impact, as bacterium survival strategies also enhances both directly and indirectly. Therefore, the search for new drug or novel vaccine candidate’s research by in-silico mode is required for rapid development of treatment. While analyzing the series GSE3693, it was found that thermic stress on bacterium can activate bacterium survival genetic makeup.
Acknowledgement
All authors are thankful towards school of bioengineering and biosciences for providing computational facilities and support for the conduction of microarray analysis.
Ethical Approval Statement
“This article does not contain any studies with human participants or animals performed by any of the authors.”
Conflict of Interest
All authors have no conflict of interests
Author Contribution
AJ and VK conducted the research study, designed and verified the Manuscript.
References
- A. Boumaza, E.B. Azzouz, J. Arrindell, H. Lepidi, S. Mezouar, et al. Whipple's disease and Tropheryma whipplei infections: From bench to bedside, The Lancet Infectious Diseases, 18(2022):77-85.
- A.K. Keita, O. Mediannikov, P. Ratmanov, G. Diatta, H. Bassene, et al. Looking for Tropheryma whipplei source and reservoir in rural senegal, Am J of Tropical Med and Hygiene, 88(2013):339.
- F. Fenollar, J.C. Lagier, D. Raoult, Tropheryma whipplei and whipple's disease, J Infec, 69(2014):103-112.
- N. Ruffer, M.T. Holzer, Y. Gkanatsas, I. Schinglerová, D. Boro, et al. Chronic Tropheryma whipplei infection: An important differential diagnosis of refractory polyarthritis, Zeitschrift fur Rheumatologie, 44(2022):9-15.
- J.C. Lagier, F. Fenollar, H. Lepidi, D. Raoult, Evidence of lifetime susceptibility to Tropheryma whipplei in patients with whipple's disease, J Antimicrob Chemother, 66(2011):1188-1189.
- A. Joshi, S. Krishnan, V. Kaushik, Codon usage studies and epitope-based peptide vaccine prediction against tropheryma whipplei, J Gen Engg Biotech, 20(2022):1-12.
- A. Joshi, V. Kaushik, In-silico proteomic exploratory quest: Crafting T-cell epitope vaccine against whipple’s disease, Intern J Peptide Res Therapeutics, 27(2021):169-179.
- R. Edgar, M. Domrachev, A.E. Lash, Gene expression omnibus: NCBI gene expression and hybridization array data repository, Nucleic Acids Res, 30(2002):207-210.
- Y. Shi, D. Chang, W. Li, F. Zhao, X. Ren, et al. Identification of core genes and clinical outcomes in tumors originated from endoderm (gastric cancer and lung carcinoma) via bioinformatics analysis, Medicine, 100(2021):e25154.
- W. Li, Volcano plots in analyzing differential expressions with mRNA microarrays, J Bioinfo Comput Bio, 10(2012):1231003.
- M.E. Ritchie, B. Phipson, D.I. Wu, Y. Hu, C.W. Law, et al. Limma powers differential expression analyses for rna-sequencing and microarray studies, Nucleic Acids Res, 43(2015):e47-e47.
- Y. Wu, P. Tamayo, K. Zhang, Visualizing and interpreting single-cell gene expression datasets with similarity weighted nonnegative embedding, Cell Sys, 7(2018):656-666.
- T. Barrett, S. E. Wilhite, P. Ledoux, C. Evangelista, I. F. Kim, et al. NCBI GEO: Archive for functional genomics data sets-update, Nucleic Acids Res, 41(2012): D991-D995.
- W.G. Alvord, J.A. Roayaei, O.A. Quiñones, K.T. Schneider, A microarray analysis for differential gene expression in the soybean genome using Bioconductor and R, Briefings in Bioinfo, 8(2007):415-431.
- J.J. Chen, S.J. Wang, C.A. Tsai, C.J. Lin, Selection of differentially expressed genes in microarray data analysis, Pharmacogenomics J, 7(2007):212-220.
- E. Kristiansson, A. Sjögren, M. Rudemo, O. Nerman, Quality optimised analysis of general paired microarray experiments, Stat App Gen Molecular Bio, 5(2006):1-5.
- G.K. Smyth, Y.H. Yang, T. Speed, Statistical issues in cDNA microarray data analysis, In Func Gen, Humana Press, 224(2003):111-136.
- R. Chowdhury, G.K. Sahu, J. Das, Stress response in pathogenic bacteria, J Biosci, 21(1996):149-160.
- Y. Han, D. Zhou, X. Pang, L. Zhang, Y. Song, et al. (2005). DNA microarray analysis of the heat-and cold-shock stimulons in Yersinia pestis, Microbes Infection, 7(2005):335-348.
- H.K. Kagawa, T. Yaoi, L. Brocchieri, R.A. McMillan, T. Alton, et al. The composition, structure and stability of a group II chaperonin are temperature regulated in a hyperthermophilic archaeon, Mol Microbiology, 48(2003):143-156.
- T. Tenson, A. Mankin, Antibiotics and the ribosome, Mol Microbiology, 59(2006):1664-1677.
Copyright: © 2022 Amit Joshi, et al. This is an open access article distributed under the terms of the Creative Commons Attribution License, which permits unrestricted use, distribution, and reproduction in any medium, provided the original work is properly cited.

