

Research Article: Journal of Drug and Alcohol Research (2023) Volume 12, Issue 7
PREPARATION, EVALUATION AND STATISTICAL OPTIMIZATION OF PRASUGREL NANOSUSPENSION
P. Bhaskar Reddy1, C.K. Dhanapal1 and Shaik Harun Rasheed2*2Department of Pharmaceutics, Guru Nanak institutions Technical Campus, India
Shaik Harun Rasheed, Department of Pharmaceutics, Guru Nanak institutions Technical Campus, India, Email: shaikharunrasheed@gmail.com
Received: 01-Aug-2023, Manuscript No. JDAR-23-114567; Editor assigned: 03-Aug-2023, Pre QC No. JDAR-23-114567 (PQ); Reviewed: 17-Aug-2023, QC No. JDAR-23-114567; Revised: 22-Aug-2023, Manuscript No. JDAR-23-114567 (R); Published: 29-Aug-2023, DOI: 10.4303/JDAR/236254
Abstract
Background: To enhance the solubility of Prasugrel it was made in the form of Nanosuspension.
Objectives: The study focused on the preparation of Nanosuspension which could improve the bioavailability.
Methods: Various stabilizers were taken and verified in order to understand the solubility in suitable stabilizer. It was found that it had high solubility in Trilaurin and Evaporative Precipitation method was selected as a suitable choice.
Results: The nanosuspensions prepared were statistically optimized using 3 level factorial design and from the overlay plot, it was further confirmed about optimized results obtained.
Conclusion: The preparation of Prasugrel Nanosuspension resulted in improving the solubility, bioavailability when compared to the pure drug. Statistical optimization technique helped in selection of best formulation among the various formulations prepared. Hence, from the results obtained it is confirmed that delivery of Prasugrel into NP one of the best dosage form.
Keywords
Prasugrel nanosuspension; Trilaurin; Statistical optimization
Introduction
Prasugrel is a novel 3rd generation oral thienopyridine mainly used to reduce the risk of thrombotic cardiovascular events such as stent thrombosis or myocardial infarctions in patients with Acute Coronary Syndrome (ACS). Prasugrel is a BCS class II drug and exhibits pH dependent solubility and it is very soluble at low pH conditions and least soluble with increase in pH. The active metabolite of prasugrel has an elimination half-life of 7 hours with an approximate bioavailability of 80%. Even it has high bioavailability; it is variable because of poor solubility [1-5]. It is more potent and has lower inter-individual variability in platelet response, and faster onset of activity.
In order improve the solubility of the drug various techniques were studied and it was proved that complexation with cyclodextrins, nanosuspensions both methods gave enhanced solubility [6-8]. However, in the present study nanosuspensions were prepared and observed that they had better solubility.
Materials
Prasugrel is a gift sample from Lupin pharma, Trilaurin and Triolein obtained from Merck, PVA, PVP K-30, HPC, Pluronic F 68, Pluronic F-127 purchased from indiamart.
Methods
Appearance and melting point
The organoleptic characteristics like colour, odour and texture were observed by sensory organs. The melting point was determined using capillary fusion method where a small amount of drug was filled in a capillary sealed from one side and kept inverted i.e. sealed end downwards into the melting point apparatus [9-11]. The temperature at which drug started liquefy was recorded and compared with literature value.
Solubility study
The solubility study of prasugrel was carried out in various solvents. Accurately weighed 20 mg of drug was added to screw capped vials containing 10 ml of solvent. The vials were kept in a water bath shaker at 37°C ± 0.5°C and shaken for 24 h. The mixtures were then filtered through millipore filter membrane of pore size 0.45 μm, diluted and drug was analyzed using UV spectrometer.
Determination of absorption maxima (λmax) of prasugrel using UV spectrophotometer
1000 μg/ml of stock solution of Prasugrel was prepared by dissolving 50 mg of drug in 0.1 N HCl and diluting 1 ml of above solution to 10 ml with 0.1 N HCl. The 10 μg/ml of drug concentrations were then prepared and scanned using UV spectrophotometer to determine the λmax of drug. Observed λmax of Prasugrel was at 222 nm.
Preparation of calibration curve of prasugrel
The calibration curve of prasugrel was prepared in 0.1 N HCl. Accurately weighed 50 mg of drug was dissolved in 50 ml of 0.1 N HCl to obtain concentration of 1 mg/ml. The 1 ml of prepared solution was further diluted 10 times to obtain stock solution of 100 μg/ml. Different aliquots were withdrawn and diluted to form concentrations of 10 μg/ml, 20 μg/ml, 30 μg/ml, 40 μg/ml, 50 μg/ml. The absorption was linear in the concentration range of 10 μg/ml-50 μg/ ml.
Preparation of prasugrel nanosuspensions
Selection of stabilizer: 0.1% (w/v) solution of PVA, PVP K-30, HPC, Pluronic F 68, Pluronic F-127, Trilaurin and Triolein were used as candidate to select the appropriate stabilizers for preparing Prasugrel nanosuspension. The results show that Trilaurin and Triolein allowed the production of submicronsized particles with the small diameter of 380 nm and 385 nm respectively. Trilaurin showed the narrow particle size distribution, in comparison of other stabilizers. So in this current study Trilaurin was employed as stabilizer.
Method of preparation of prasugrel nanoparticles using evaporative precipitation of nanoparticles: Nanosuspensions were prepared by evaporative precipitation Ultrasonication method. 100 mg of Prasugrel was dissolved in 10 ml methanol at room temperature. Trilaurin was dissolved in water to form a series of anti-solvents ranging in concentration from 0.5% w/v-1.5% w/v. Solution was filtered through a 0.22 μm syringe filter (RanDisc nylon syringe filter). 10 ml of organic solution was added slowly drop wise with a syringe into the 20 ml of Trilaurin solution and kept at a low temperature (4°C) in an iced water bath. During injection, the mixture was stirred continuously by the mechanical stirrer at 1000 rpm for 2.5 h. After the antisolvent precipitation, the volatile solvent was evaporated by subsequently stirred the mixture at 300 rpm for next 3 h then sample was transferred to a test tube having the capacity of 30 ml. Each of samples was treated with an ultrasonic probe (Bandelin Sonoplus, Berlin, Dermany) at various cycles ranging from 2 × 10%-7 × 10%, and power input ranging from 30%W-80%W) and for various duration (5 min-40 min). The probe (tip diameter, 8 mm) was immersed about 10 mm-12 mm in the liquid by which waves was travelled downwards and reflected upwards. During ultrasonication the temperature was also controlled by using ice water bath.
Factorial design: A 32 randomized full factorial design was used in this study and 2 factors were evaluated, each at 3 levels, experimental trials were performed at all 9 possible combinations. Concentation of Trilaurin (X1) and Ultrasonication time (X2) were selected as 2 independent variables which were varied at 3 levels, low level (-1), medium level (0), high level (+1).
Amount of Prasugrel (10 mg) was kept constant. Particle size (Y1), zeta potential (Y2) and Polydispersibility index (Y3) were selected as dependent variables. Values of variables and formulation codes are shown in the Tables 1 and 2. Design-Expert® 12 software trial version was used for the generation and evaluation of statistical experimental design.
Table 1: Variables in 32 factorial designs
| Independent variable | Levels | ||
|---|---|---|---|
| Low (%w/v) | Medium (%w/v) | High (%w/v) | |
| X1: Trilaurin | 0.5 | 1 | 1.5 |
| X2: Ultrasonication time | 10 | 15 | 20 |
| Dependent variable | - | - | - |
| Y1: Particle size (nm) | - | - | - |
| Y2: Zeta potential (Mv) | - | - | - |
| Y3: Polydispersibility index (PDI) | - | - | - |
Table 2: Compositions of Prasugrel Nanosuspension
| Formulation | Conc of Trilaurin (%w/v) | Ultrasonication time (days) |
|---|---|---|
| F1 (-1,-1) | 0.5 | 10 |
| F2 (-1,0) | 0.5 | 15 |
| F3 (-1,+1) | 0.5 | 20 |
| F4 (0,-1) | 1 | 10 |
| F5 (0,0) | 1 | 15 |
| F6 (0,+1) | 1 | 20 |
| F7 (+1,-1) | 1.5 | 10 |
| F8 (+1,0) | 1.5 | 15 |
| F9 (+1,+1) | 1.5 | 20 |
Determination of particle size distribution, Polydispersity Index (PDI), and zeta potential of SLN: The particle size distribution, polydispersity index, and zeta potential of Prasugrel loaded nanosuspension were measured using a Malvern Zetasizer. About 100 μl of the prepared nanosuspension was diluted to 5 ml with double distilled water and analyzed with Zetasizer. Photon correlation spectroscopy is the most widely used technique for measurement of particle size and zeta potential. The principle of dynamic light scattering at a scattering angle of 90° is used to measure particle size.
Statistical analysis of the data and optimization: Response surface modelling and evaluation of the quality of fit of the model for the current study were performed employing Design Expert® 12 software trial version. Polynomial models including linear, interaction and quadratic terms were generated for all the response variables using Multiple Linear Regression Analysis (MLRA).
A second order polynomial equation that describes the effect of independent factors on the response is expressed in the following forms:
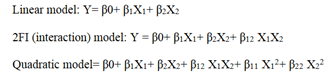
Where, Y is the dependent variable, β0 is the arithmetic mean response of the 9 runs, and β1 and β2 are the estimated coefficients for the factors X1 and X2 respectively. The main effect (X1 and X2) represents the average result of changing 1 factor at a time from its low to high value. The interaction term (X1X2) shows how the response changes when 2 factors were changed simultaneously. The polynomial terms (X1X1, X2X2) are included to investigate nonlinearity. The equation enables the study of the effects of each factor and their interaction over the considered responses.
The polynomial equation was used to draw conclusions after considering the magnitude of coefficients and the mathematical sign it carries, i.e., positive or negative. A positive sign signifies a synergistic effect, whereas a negative sign stands for an antagonistic effect. The best fitting mathematical model was selected based on the comparisons of statistical parameters which include the Coefficient of Variation (CV), the coefficient of determination (R2), adjusted coefficient of determination (adjusted R2) and the Predicted Residual Sum of Square (PRESS), provided by Design Expert software.
Among them, PRESS indicates how well the model fits the data and for the chosen model it should be small relative to the other models under consideration. Level of significance was considered at p<0.05. Mathematical relationships in the form of polynomial equations are generated using Multiple Linear Regression Analysis (MLRA) and used to find out the relative influence of each factor on the response.
Analysis of Variance (ANOVA) for the responses was performed to identify significant effect of factors on responses and the model parameters were obtained. The relationship between the dependent and independent variables was further elucidated using contour and response surface plots. These plots are very useful to study of the effects of 2 factors on the response at one time and predict the responses of dependent variables at the intermediate levels of independent variables. Subsequently, a numerical optimization technique by the desirability and graphical optimization technique by the overlay plot approach were used to generate the new formulation with the desired responses. An optimized formulation was developed by setting constraints (goals) on the dependent and independent variables.
Results and Discussion
Appearance and melting point
In order to confirm the nature of drug, it is studied for appearance, odour and Melting point. All the characters were tabulated below as Table 3.
Table 3: Organoleptic characters of Prasugrel
| Drug | Parameter | Reported | Observed |
|---|---|---|---|
| Prasugrel | Appearance | Brown color | Light brown |
| Odour | None | None | |
| Melting point | 122°C | 123°C |
Determination of solubility
The solubility test was performed using different solvents. It was found that the drug has highest solubility in 0.1 N HCl. As shown in Table 4.
Table 4: Solubility of Prasugrel in various solvents
| Solvent | Prasugrel |
|---|---|
| Solubility (µg/ml) | |
| Distilled water | 3.2 ± 0.2 |
| 0.1 N HCl | 156.3 ± 0.1 |
| pH 4.0 | 102.6 ± 0.2 |
| Phosphate buffer pH 6.8 | Insoluble |
| Ethanol | 103 ± 0.05 |
| Methanol | 92 ± 0.3 |
Determination of λmax
Wavelength of the drug plays major role in studying various other parameters. Hence, the wavelength was studied and found that at 222 nm. It was shown as Figure 1.

Figure 1: λmax of Prasugrel was at 222 nm
Construction of calibration curve
Calibration curve of Prasugrel was constructed and found that concentration ranges from 10 μg/ml-50 μg/ml. The Table 5 shows the relationship between concentration and absorbance and graphically represented as Figure 2. The statistical parameters were tabulated as Table 6.
Table 5: Concentration vs Absorbance
| Concentration (µg/ml) | Absorbance (nm) |
|---|---|
| 0 | 0 |
| 10 | 0.223 ± 0.02 |
| 20 | 0.445 ± 0.55 |
| 30 | 0.653 ± 0.35 |
| 40 | 0.869 ± 0.67 |
| 50 | 0.979 ± 0.44 |
Table 6: Statistical parameters for standard curves of Prasugrel in pH 1.2
| S. No | Parameter | pH 1.2 |
|---|---|---|
| 1 | λmax (nm) | 222 |
| 2 | Linearity range (µg/ml) | 10-50 |
| 3 | Regression equation | y=0.0201x+0.0252 |
| 4 | Intercept | 0.0252 |
| 5 | Slope | 0.0201 |
| 6 | Correlation coefficient (R2) | 0.991 |

Figure 2: Standard plot of Prasugrel in pH 1.2
Identification of particle size distribution, polydispersity index (PDI), and zeta potential of SLN
The prepared NS as per the formulation were studied for particle size, PDI, Zetapotential. These help in understanding the nature of SLN. As shown in Table 7.
Statistical optimization of prepared nanosuspension
All the responses observed for 9 runs (3 different bases of Nanosuspension) were simultaneously fitted to linear, interaction and quadratic models using Design Expert software trial version 12.
Table 7: Observed responses of Prasugrel loaded Nanosuspension
| Batch | Conc of Trilaurin (%w/v) | Ultrasonication time (days) | Particle Size (nm) | Zeta potential (mV) | PDI |
|---|---|---|---|---|---|
| PF1 | 0.5 (-1) | 5 (-1) | 0.226 | -20.3 | 0.54 |
| PF2 | 0.5 (-1) | 10 (0) | 0.282 | -22.4 | 0.5 |
| PF3 | 0.5 (-1) | 15 (+1) | 0.378 | -23.9 | 0.49 |
| PF4 | 1 (0) | 5 (-1) | 1.28 | -25.5 | 0.47 |
| PF5 | 1 (0) | 10 (0) | 1.35 | -27.1 | 0.42 |
| PF6 | 1 (0) | 15 (+1) | 1.54 | -29.2 | 0.4 |
| PF7 | 1.5 (+1) | 5 (-1) | 1.34 | -26.4 | 0.39 |
| PF8 | 1.5 (+1) | 10 (0) | 1.49 | -28.2 | 0.35 |
| PF9 | 1.5 (+1) | 15 (+1) | 1.57 | -30.5 | 0.3 |
The comparative values of R2, adjusted R2, predicted R2, PRESS, s.d, %CV at significant p values (P<0.05), are given in Table 8. A suitable polynomial model for describing the data was selected based on coefficient of determination (R2) and PRESS values. The 3 responses Y1, Y2, Y3 of nanosuspension were independent, for nanosuspension prepared, the responses Y1, Y2 followed quadratic model whereas Y3 followed linear model.
Table 8: Regression analysis summary of Prasugrel based Nanosuspension for responses Y1, Y2 and Y3
| Model R2 | R2 | Adjusted R2 | Predicted R2 | PRESS | s.d. | F-value | p-value | Remarks | ||
|---|---|---|---|---|---|---|---|---|---|---|
| Response Y1 (Particle size (nm))=1.38+0.58A+0.107B+0.0195AB-0.509 A²+0.015 B² | ||||||||||
| Linear | 0.802 | 0.736 | 0.5822 | 1.1 | 0.29 | 12.15 | 0.007 | - | ||
| Interactive | 0.802 | 0.684 | 0.2476 | 1.9 | 0.3 | 0.014 | 0.908 | - | ||
| Quadratic | 0.998 | 0.9951 | 0.9823 | 0.0467 | 0.0392 | 168.36 | 0.00082 | Suggested | ||
| Response Y2 (Zeta Potential mV)=-27.2-3.08 A-1.9 B-0.125AB+1.9A²-0.06B² | ||||||||||
| Linear | 0.906 | 0.8758 | 0.802 | 17.1 | 1.16 | 29.21 | 0.0008 | - | ||
| Interactive | 0.907 | 0.852 | 0.647 | 30.5 | 1.26 | 0.03 | 0.851 | - | ||
| Quadratic | 0.998 | 0.995 | 0.981 | 1.57 | 0.217 | 83.2 | 0.002 | Suggested | ||
| Response Y3 PDI=+15.57+0.10667*A+0.24667*B | ||||||||||
| Linear | 0.5466 | 0.4459 | 0.1473 | 1690 | 9.99 | 5.43 | 0.0285 | Suggested | ||
| Interactive | 0.6873 | 0.14 | -35.966 | 73263.1 | 12.45 | 0.057 | 0.9453 | - | ||
| Quadratic | 0.6784 | 0.4103 | -1.1821 | 21 | 4324.668 | 1.06 | 0.4036 | - | ||
The fitted polynomial equations relating the responses are given in Table 9. Model parameters obtained from analysis of variance (ANOVA) for the responses Y1-Y3. These parameters were used to construct the models that describe the effect of the independent variables on the responses (Y1-Y3).
Table 9: Model parameters (ANOVA) for the dependent responses of Prasugrel based Nano suspension
| Source | SS | df | MS | p-value | Significance |
|---|---|---|---|---|---|
| Response Y1 | |||||
| Model | 2.64 | 5 | 0.52 | 343.7 | S |
| X1 | 2.07 | 1 | 2.05 | 1336.2 | - |
| X2 | 0.068 | 1 | 0.064 | 44.6 | - |
| X1X2 | 0.0015 | 1 | 0.002 | 0.987 | - |
| X12 | 0.518 | 1 | 0.518 | 336.4 | - |
| X22 | 0.0004 | 1 | 4E-04 | 0.29 | - |
| Residual | 0.0046 | 3 | 0.001 | - | - |
| Total | 2.6515 | 8 | - | - | - |
| Response Y2 | |||||
| Model | 86.64 | 5 | 17.32 | 366.2 | S |
| X1 | 57.04 | 1 | 57.04 | 1205.5 | - |
| X2 | 21.66 | 1 | 21.66 | 457.7 | - |
| X1X2 | 0.0625 | 1 | 0.063 | 1.32 | - |
| X12 | 7.86 | 1 | 7.86 | 166.2 | - |
| X22 | 0.008 | 1 | 0.008 | 0.187 | - |
| Residual | 0.141 | 3 | 0.04 | - | - |
| Total | 86.7 | 8 | - | - | - |
| Response Y3 | |||||
| Model | 1083.3 | 2 | 541.6 | 0.0285 | S |
| X1 | 170.6 | 1 | 171.6 | 0.2235 | - |
| X2 | 912.6 | 1 | 912.6 | 0.0144 | - |
| Residual | 898.5 | 9 | 99.8 | - | - |
| Total | 1981.8 | 11 | - | - | - |
From the ANOVA data, the F values were 168.36, 83.2 and 5.43 respectively. The P value less than 0.05 for the response factors indicated that the models are significant (Figures 3-8)

Figure 3: Contour plots for the effects of Trilaurin (X1) and Ultrasonication time (X2) on particle size (Y1) in Prasugrel based nanosuspensions

Figure 4: Response surface plots for the effects of Trilaurin (X1) and Ultrasonication time (X2) on particle size (Y1) in Prasugrel based nanosuspensions

Figure 5: Contour plots for the effects of Trilaurin (X1) and Ultrasonication time (X2) on zeta potential (Y2) in Prasugrel based nanosuspensions

Figure 6: Response surface plots for the effects of Trilaurin (X1) and Ultrasonication time (X2) on zeta potential (Y2) in Prasugrel based nanosuspensions

Figure 7: Contour plots for the effects of Trilaurin (X1) and Ultrasonication time (X2) Polydispersibility index (Y3) in Prasugrel based nanosuspensions

Figure 8: Response surface plots for the effects of Trilaurin (X1) and Ultrasonication time (X2) on Polydispersibility index (Y3) in Prasugrel based nanosuspensions
Optimization
To optimize 3 responses with different targets, a multi-criteria decision approach, like a numerical optimization technique by the desirability function and graphical optimization technique by the overlay plot were used. The optimized formulation was obtained by applying constraints (goals) on dependent (response) and independent variables (factors). Optimum formulation was selected based on the criteria of minimum particle size (1.57 nm ± 0.2 nm), higher zeta potential (-30.5 mV ± 1.1 mV) and low PDI. Various feasibility and grid searches were executed to establish the optimum formulation by plotting desirability function response plot and overlay plot, where one solution was found with a desirability of 1.0. The recommended Trilaurin (X1) and Ultrasonication time (X2) were calculated by the Design Expert 12 software trial version.
Optimization was carried out by both numerical optimization and graphical optimization techniques. Nanosuspensions desirability and overlay plots are shown respectively in Figures 9 and 10. The desirability function was found to be higher (which are near to 1) for the optimized formula indicating the suitability of the formulations.
The optimized nanosuspension contain 1.5% w/v of Trilaurin and 15 days of ultrasonication time. Predicted model formulations were found matching with the optimized PF9 formulation.

Figure 9: Nanosuspensions desirability of Prasugrel

Figure 10: Overlay plot of Prasugrel optimized formulation
The optimized nanosuspension contain 1.5% w/v of Trilaurin and 15 days of ultrasonication time. 10 mg of Prasugrel was kept constant in all the formulations. The prepared optimized formulations were found to be of good quality fulfilling all the requirements of nanosuspension.
Conclusion
The preparation of Prasugrel Nanosuspension resulted in improving the solubility, bioavailability when compared to the pure drug. Statistical optimization technique helped in selection of best formulation among the various formulations prepared. Hence, from the results obtained it is confirmed that delivery of Prasugrel into NP one of the best dosage form.
Acknowledgement
None.
Conflict Of Interest
Authors have no conflict of interest to declare.
References
- N.B. Norgard, M. Abu-Fadel, Comparison of prasugrel and clopidogrel in patients with acute coronary syndrome undergoing percutaneous coronary intervention, Vasc Health Risk Manag, 5(2009):873-82.
- R. Devara, A. Jithan, H. Mohammed, Preparation, characterization and evaluation of prasugrel hydrochloride nanosuspensions: Its enhancement of dissolution rate and oral bioavailability, J Pharm Pharmacol Res, 5(2022).
[Crossref]
- D. Seiler, K. Doser, I. Salem, Relative bioavailability of prasugrel free base in comparison to prasugrel hydrochloride in the presence and in the absence of a proton pump inhibitor, Arzneimittelforschung, 61(2011):247-51.
- D.S. Small, N.A. Farid, C.D. Payne, G.J. Weerakkody, Y.G. Li, et al. Effects of the proton pump inhibitor lansoprazole on the pharmacokinetics and pharmacodynamics of prasugrel and clopidogrel, J Clin Pharmacol, 48(2008):475-484.
- J. Cen, C. Zhang, Q. Zhang, A. Lu, Pharmaceutical composition for improving solubility of Prasugrel and its preparation method, 2013.
- Y. Kawabata, K. Wada, M. Nakatani, S. Yamada, S. Onoue, Formulation design for poorly water-soluble drugs based on biopharmaceutics classification system: Basic approaches and practical applications, Int J Pharm, 420(2011):1-10.
- Y. Liu, D. Zhang, D. Zou, Y. Wang, C. Duan, et al. Development and in vitro characterization of bifendate nanosuspensions, J Biomed Nanotech, 7(2011):6211.
- V.R. Patel, Y.K. Agrawal, Nanosuspension: An approach to enhance solubility of drugs, J Adv Pharm Technol Res, (1988):189-226.
- P. Nagaraju, K. Krishnachaithanya, V.D. Srinivas, S.V. Padma, Nanosuspensions: A promising drug delivery systems, Int J Pharm Sci Nano, 2(2009):175-204.
- G.G. Liversidge, K.C. Cundy, Particle size reduction for improvement of oral bioavailability of hydrophobic drugs: Absolute oral bioavailability of nanocrystalline danazol in beagle dogs, Int J Pharm, 125(1995):91-7.
- M.J. Grau, O. Kayser, R.H. Muller, Nanosuspensions of poorly soluble drugs reproducibility of small-scale production, Int J Pharm, 196(2000):155-7.
Copyright: © 2023 P. Bhaskar Reddy, et al. This is an open access article distributed under the terms of the Creative Commons Attribution License, which permits unrestricted use, distribution, and reproduction in any medium, provided the original work is properly cited.