Research Article: Journal of Drug and Alcohol Research (2022) Volume 11, Issue 12
Novel Validated LC-MS/MS Method for Simultaneous Estimation of Celecoxib and Amlodipine in Rat Plasma and its Application to a Pharmacokinetic Study
M. Mukkanti Eswarudu1,2, A. Lakshmana Rao3* and K. Vijay42Department of Pharmacy, Vignan Pharmacy College, India
3Department of Pharmacy, V.V. Institute of Pharmaceutical Sciences, India
4Department of Pharmacy, Quest International University, Malaysia
A. Lakshmana Rao, Department of Pharmacy, V.V. Institute of Pharmaceutical Sciences, India, Email: dralrao@gmail.com
Received: 30-Nov-2022, Manuscript No. JDAR-22-81441; Editor assigned: 02-Dec-2022, Pre QC No. JDAR-22-81441 (PQ); Reviewed: 16-Dec-2022, QC No. JDAR-22-81441; Revised: 21-Dec-2022, Manuscript No. JDAR-22-81441 (R); Published: 28-Dec-2022, DOI: 10.4303/JDAR/236214
Abstract
The combination of celecoxib (CLX) and Amlodipine (AMD) was approved for hypertensive patients with osteoarthritis by US-FDA. Hence, a potential analytical method that can simultaneously quantify these two drugs is required. In view of this, a novel and fully validated liquid chromatography-electrospray ionization-tandem mass spectrometric (LC-ESI-MS/MS) method has been established for the quantification of CLX and AMD in rat plasma simultaneously. Protein precipitation extraction technique was employed for the extraction of analytes and their deuterated analogues from rat plasma quantitatively. The analytes were separated using the mobile phase comprising of acetonitrile–water with 0.1% formic acid buffer (70:30 v/v) and a flow-rate of 1.0 mL/min and 10 minutes run time on Agilent SB-C18 analytical column. The multiple reaction monitoring transitions, m/z 504.7→98.1 for CLX, 492.8→129.3 for AMD; 385.6→102.8 for CLX-D4 and 496.8.5→412.3 for AMD-D4 were utilized for the analysis in order to attain high selectivity. The method showed good sensitivity and linearity in the range of the concentration 20 ng/mL–800 ng/mL for CLX and 0.25 ng/mL–10 ng/mL for AMD respectively. Moreover, the method also displayed decent accuracy (87.9%- 100.27% and 99.28%-103.26%) for CLX and AMD and precision according to US-FDA guidelines. The precision values for inter-and intra-day were between 1.92.02%-7.085% and 0.083%-3.43% and for CLX and AMD respectively. Further, the results of the pharmacokinetic parameters including Cmax, tmax, AUC0-t, AUC0-∞ and t1/2 values of drugs indicated that the developed method is valuable for the successful quantification of the analytes in rat plasma. The developed method is significant and is useful for simultaneous quantification of CLX and AMD.
Keywords
Amlodipine; Celecoxib; LC-MS/MS; Rat plasma; Validation
Introduction
Due to modern lifestyles and stress, hypertension and osteoarthritis are significant health issues in the middle and older age population. In general, these two illnesses coexist, with hypertension being identified in 40% of osteoarthritis patients [1]. Hence, a fixed dose combination of Celecoxib and Amlodipine besylate was approved by US-FDA for the treatment of hypertension and osteoarthritis [2,3].
Celecoxib (CLX) is chemically 4-[5-(4-methylphenyl)- 3,7-(trifluoromethyl)-1H-pyrazol-1-yl] benzene sulphonamide. It is an NSAID that selectively inhibits cyclooxygenase- 2 (COX-2) enzyme and is used to treat osteoarthritis with superior in action to other NSAIDS with minimal gastrointestinal and renal toxicity [4-6]. Amlodipine (AMD) is chemically [3-ethyl5-methyl (4RS)-2-[(2-aminoethoxy) methyl]-4-(2-chlorophenyl)-methyl-1-dihydropyridine3,5- dicarboxylate] benzenesulfonate that inhibit L-type calcium ion channels of the blood vessels and is used in the treatment of hypertension and angina pectoris. The Absolute bioavailability of CLX and AMD are 64%- 88% and 64%-90% respectively [7].
Scientists have reported different analytical methods for the quantification of the above fixed dose combination in synthetic mixtures, pharmaceutical formulation and biological fluids. For instance, UV, TLC, HPLC and LC-MS/MS methods have been developed [8-17]. Overall, 10 studies have been reported for the estimation of Celecoxib and Amlodipine simultaneously among which only two papers had described quantification of the two drugs in biological samples using HPLC and LC-MS/MS. However, these methods are less sensitive as they were able to quantify CLX and AMD in [LLOQ: 60, 600 ng/ mL and [LOD: AMD- 0.00028, CLX-0.00027 μg/band]] levels [15,17]. Hence, a more sensitive analytical approach for estimating this fixed dosage combination in biological matrices is necessary. Considering the above facts, we established and validated a new LC–MS/MS method for concurrent quantification of CLX and AMD in rat plasma. The proposed technique can be used to produce pharmacokinetic data that will help to plan further clinical trials and to conduct appropriate post-marketing research. The structures of CLX, AMD and their deuterated analogues [Celecoxib-D4 (CLX-D4), Amlodipine- D4 (AMD-D4)] used in the study are represented in Figure 1 and the parameters of the present method were compared with the previous methods in Tables 1 and 2.
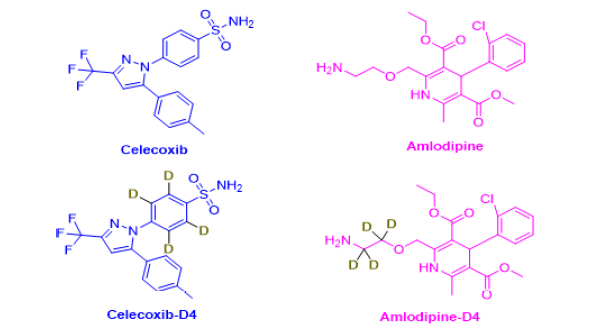
Figure 1: Chemical structure of Celecoxib, Amlodipine, and intern
| S. No. | Drugs | Pharmaceutical or Biological matrix | Solvent Wavelength (nm) | Linearity | Assay (%) | Accuracy of the study (%) | Sensitivity (μg /mL) | Ref. |
|---|---|---|---|---|---|---|---|---|
| 1 | CLX and AMD | Synthetic tablet dosage form (200 mg and 10 mg/tablet) | Methanol, 250 nm and 290 nm | 15–40 µg/mL and 3–8 µg/mL | 99.29 and 99.33 | 99.78% and 100.36% | LOD: 0.686 and 0.156 LOQ: 2.080 and 0.475 | 8 |
| 2 | CLX and AMD | Synthetic tablet dosage form (200 mg and 10 mg/tablet) | 2M sodium benzoate as a hydrotropic solution Method 1& 2 255 nm and 243nm | 10-50 µg/mL and 2-10 µg/mL | Method 1 99.22 and 98.74 Method 2 99.49 and 97.89 | Method 1 95.64 and 99.31 Method 2 98.86 and 98.54 | LOD: 0.343 and 0.298 LOQ: 0.734 and 0.081 | 9 |
| 3 | CLX and AMD | Laboratory prepared AML (10 mg) tablets and CEL (200 mg) capsules | Ethanol, 254.2 nm, and 334.2 nm | 5–40 µg/mL and 1–6 µg/mL | Method 1 99.34 and 99.79 Method 2 99.70 and 100.13 | Method 1 99.79 and 100.13 Method 2 99.34 and 99.7 | LOD: Method 1 0.35 and 0.21 Method 2 0.46 and 0.28 LOQ: Method 1 0.97 and 0.65 Method 2 1.27 and 0.83 | 10 |
| 4 | CLX and AMD | Laboratory formulated mixture and CEL (200 mg) capsules AML (10 mg) tablets | Ethanol, 286.7 nm, 364.3nm | 5 to 40 μg/mL and 0.5 to 10 μg/mL | CLX Mixture and tablets Method 1 99.29 and 101.87 Method 2 98.90 99.03 AMD Mixture and tablets Method 1 98.41 and 98.54 Method 2 99.08 and 98.55 | CLX Method 1 99.69 Method 1 99.95 AMD Method 1 99.63 Method 2 99.68 | LOD: Method 1 0.45 and 0.14 Method 2 0.34 and 0.31 LOQ: Method 1 1.24 and 0.42 Method 2 0.99 and 0.92 | 11 |
| 5 | AMD, CLX and MAP | Laboratory formulated mixture | Methanol, 250 nm and 290 nm | 2–100, 10–200 and 0.5–20 µg/mL for AMD, CLX and MAP | CLX -100.97, AMD-100.34, MAP-100.81 | CLX: 100.08, 99.75,100.00,99.98, 100.97 AMD: 100.7, 99.81, 100.62, 99.62, 99.93, 100.34, 100.08 | LOD: 0.583, 3.118 and 0.147 for AMD, CEL and MAP | 12 |
Note: CLX: Celecoxib; AMD: Amlodipine; MAP: Methylacetophenone.
Table 1: Ultra-violet Spectrophotometric methods reported on selected drugs Celecoxib and Amlodipine.
| S. No. | Drugs | Pharmaceutical or Biological matrix | Stationary Phase | Chromatographic conditions | Linearity | Sensitivity (µg/mL) | Ref. |
|---|---|---|---|---|---|---|---|
| 1 | AMD and CLX | TLC CEL and AMLO in their laboratory prepared mixture. CEL and AMLO (200/10 mg) | TLC silica gel 60 glass plates for FL detection mode | Ethyl acetate: diethylamine: 1-propanol (9:1:0.2, v/v) | CLX: 30.0–300.0 ng/band (mg/mL) AMD:15.0–150.0 ng/band (mg/ method mL) | Limit of detection (LOD), ng/band: TLC- Abs: 41.2 and 14.9 TLC- Fl: 9.6 and 4.0 Limit of quantitation (LOQ), ng/band: TLC- Abs: 124.7, 45.2 TLC- Fl: 29.1, 12.2 | 13 |
| 2 | CLX and AMD | HPLC Synthetic mixture | Hypersil BDS, C18 (4.6 x 250mm, 5μm) | Mobile Phase: Buffer (potassium phosphate pH4.5): Methanol (85:15% v/v) Flow rate: 1.0 mL/min; Run time: 8 min Injection volume: 20 µL D. wavelength: 240 nm. PDA detector. | CLX: 20 -60 μg/mL, AMD 1-3 μg/mL | LOD: CLX 1.557 µg/mL AMD- 0.092 µg/mL LOQ: CLX 4.717 µg/mL AMD 0.278 µg/mL | 14 |
| 3 | CLX and AMD | HPLC Rat Plasma | Column: C18 Eclipse plus (250 x 4.6 mm, 5 µm) | Mobile Phase: 20 mM sodium acetate buffer (pH 4.5): methanol (30:70 v/v) Flow rate: 1.0 mL/min; Run time: 15 min Sample injection volume: 10 µL Detection Wavelength: 228 nm | CLX: 600-4200 ng/mL AMD: 60–420 ng/mL Retention time: CLX-10.69 min; AMD-7.69 min Resolution: 3.43 and 4.3 | LLOQ: CLX: 60 ng/mL AMD: 600 ng/mL | 15 |
| 4 | AMD and CLX | HPLC and HPTLC Tablet dosage form | Phenomenex C18, Silica gel 60 GF254 | HPLC: Mobile phase: methanol and water 73:27 (v/v) at a flow rate: 1.1 ml/min Detection: 265 nm HPTLC: Chloroform: Ethyl acetate: Methanol: Ammonia (4:3:4:0.1 v/v/v/v) Detection: 265 nm | HPLC: AMD: 1 –5 μg/mL and CLX: 20-100 μg/mL Retention time: AMD: 5.14 min and CLX 7.12 min HPTLC: 500-2500 ng/spot and 1000-5000 ng/spot Rf values: AMD: 0.42 and CLX: 0.70 | HPLC: LOD: AMD: 0.021 (μg/mL) CLX: 0.024 (μg/mL) LOQ AMD: 0.065 (μg/mL) CLX: 0.073 (μg/mL) HPTLC: LOD: AMD: 0.061 (ng/spot) CLX: 0.064 (ng/spot) LOQ AMD: 0.069 (ng/spot) CLX: 0.072 (ng/spot) | 16 |
| 5 | CLX AMD and MAP | LC-MS/MS, TLC Rat plasma | Zorbax Eclipse Plus C18 column | LC-MS: Methanol: aqueous solution of 5 mM formic acid (95:5 v/v) TLC: Methanol: water: ammonia (70:25:1.5) | AMD: 0.1–10 μg/band CLX; 1–150 μg/band MAP: 0.01–2 μg/band | LOD: AMD: 0.00028, CLX: 0.00027 and MAP: 0.0003 | 17 |
| 6 | CLX and AMD | LC-MS/MS Rat plasma | Agilent SB-C18 (250× 4.6 mm; 3.5 µm); | Mobile Phase: Acetonitrile: formic acid (0.1%) 70:30 v/v; Flow rate: 1.0 mL/min; Run time: 10 min, Sample injection volume: 10 µL | Linearity: CLX: 20–800 ng/mL AMD: 0.25–10.0 ng/mL RT: CLX:3.301min, CLX-D4: 3.306 min. AMD: 6.299 min AMD-D4: 6.293 min. | Retention time: LLOQ: CLX: 20 ng/mL AMD: 0.025 ng/mL | PM |
Note: CLX: Celecoxib; AMD: Amlodipine; MAP: Methylacetophenone
Table 2: Comparison of proposed method with previous previously reported methods on the analytes studied
Material and Methods
Chemicals and reagents
The CLX (99.98%) and AMD (99.96%) standards and the internal standards Celecoxib-D4 and Amlodipine-D4 were obtained as a gift sample from Glenmark, India. The solvents like acetonitrile and methanol were acquired from Merck Chemicals, Mumbai, India whereas formic acid was bought from Ranchem, Mumbai, India. HPLC grade water used in the study was purified by Milli-Q water purification system. The rest of the chemicals and reagents were procured from standard commercial suppliers.
HPLC operating conditions
Waters 2695 HPLC system containing a high-speed auto sampler, column oven, and degasser was utilised in the study. An Agilent SB-C18 column of dimensions of 250 mm × 4.6 mm lodged with a stationary phase of 3.5 μm particle size was used to inject 10 μL of sample solution. The mobile phase (70:30 v/v mixtures of acetonitrile and water containing formic acid buffer) was filtered using a membrane filter and degassed by ultrasonication for 5 minutes and then pumped into the column at flow rate of 1.0 mL/min in isocratic mode.
Mass spectrometry operating conditions
The analytes (CLX, AMD) and internal standards were quantified using a SCIEX QTRAP-5500 mass spectrometer (MDS-SCIEX, Concord, Ontario, Canada) with MS/MS detection in positive ion mode. The different source and compound parameters used in the study were Declustering potential (DP):40 V, entry potential (EP):10 V, collision cell exit potential (CXP):15, collision energy (CE):15 V for CLX and AMD respectively. The source criteria optimized were Collision gas:5 V, ion spray voltage:5500 V, and temperature: 550°C were optimised. The ions were detected in MRM mode with transition pairs of m/z 504.7→98.1, 385.6→102.8, 492.8→129.3 and 496.85→412.3 for CLX, CLX-D4, AMD and AMD-D4 respectively. Analyst SoftwareTM (version 1.4.2) was used to create and analyse the analytical data.
Preparation of buffer and mobile phase
One milli liter of formic acid was transferred and dissolved in 1 liter of milli Q System graded water before being filtered through 0.22 μ filter paper. In a 70:30 ratio, acetonitrile and buffer were combined and filtered through 0.45 μ membrane filter paper.
Preparation of stock and working standard solutions of analytes and internal standards
Primary stock solutions of 200 ng/mL concentration of CLX and AMD were prepared separately by initially dissolving 8 mg of each pure drug samples in acetonitrile-water (50:50 v/v) in 100 mL volumetric flasks and made the volume up to the mark using the same solvent. Further, 0.25 mL of the above solution each of CLX and AMD were transferred into 100 mL volumetric flasks and diluted with acetonitrile-water (50:50 v/v) mixture. Finally, 1.0 mL each of CLX and AMD above diluted samples were transferred into 10 mL volumetric flasks and made up to the volume to produce final concentrations of 200 ng/mL CLX and AMD respectively. The same diluent and protocol were employed for the preparation of stock and working solutions of the internal standard drugs-Celecoxib-D4 and Amlodipine-D4.
Preparation of calibration curve and quality control samples
Nine non-zero calibration standards in the range of 20 ng/ mL-800 ng/mL (20, 40, 100, 200, 300, 400, 500, 600, 800 ng/mL) and 0.25 ng/mL-10 ng/mL (0.25, 0.5, 1.25, 2.50, 3.75, 5.0, 6.25, 7.50, 10.0 ng/mL) for CLX and AMD were prepared. In the same way quality control (QC) samples were prepared at five concentration levels-20.0/0.25 ng/ mL (LLQC, lower limit of quality control), 200/2.5 ng/mL (LQC, lower quality control), 400/5.0 ng/mL (MQC, medium quality control), 600/7.5 ng/mL (HQC, high quality control), 800/10.0 ng/mL (ULOQC, upper limit of quality control) for CLX and AMD respectively. Calibration standards and quality control (QC) samples were spiked with respective working dilutions to get the final concentrations. The spiked samples were stored at -80°C ± 10°C. According to the validation experimental strategy, the spiked samples produced were fresh. All the stock solutions and working dilutions were kept in a refrigerator between 2°C-8°C.
Sample preparation
To assist protein precipitation, 200 μL of plasma, 500 μL of sample stock solution, 500 μL of internal standard, and 500 μL of methanol were mixed in a centrifuging tube. The mixture was cyclomixer vortexed for 2 minutes, then centrifuged at 4000 rpm for 15 minutes. After centrifugation, 10 μL of the supernatant layer was collected and transferred to a sample vial and injected into the LC-MS/MS system for the analysis.
Bioanalytical method validation
Method was fully validated according to USFDA guidelines for bioanalytical method validation [18].
Stability experiments
Stability experiments were accomplished in order to assess the stability of the analytes in plasma samples under several conditions which simulate the conditions that could occur during sample analysis. Short term stability (6 hours at room temperature), freeze and thaw stability (Three cycles at 24 hours; thawed unassisted at room temperature for 2 hours), long term stability (28 days at -80°C), auto sampler (processed sample) stability (25°C for 24 hours), and dry extract stability (24 hours at room temperature) were done at LQC, MQC, and HQC levels utilizing six replicates from each level.
Application to a pharmacokinetic study
The developed method has been used to quantify the current study drugs in rat plasma samples after finishing the full validation process. The Institutional Ethical Committee of Vignan Pharmacy College in Vadlamudi, India, gave its approval to the study (003/IAEC/RESEARCH/VPC/2018). Blood samples were collected after oral administration of a dosage equal to 400 mg/kg and 2.5 mg/kg of CLX and AMD to six Albino Wistar rats in a pharmacokinetic study. Rat blood samples were collected at 0 (Predose), 1.0, 6.0, 12, 18, 24, 30, 36, 42, 48, 54, and 60 h into the labelled poly propylene tubes and then the samples were centrifuged for 15 mintues at 4000 rpm with dipotassium ethylenediamine tetra acetic acid (K2EDTA) as an anticoagulant. The plasma samples thus collected have been preserved until analysis at -20°C. The data was analysed using Phoenix WinNonlin 8.3 version in a non-compartmental method.
Results and Discussion
Method development
The LC conditions were optimized to obtain a short run time and adequate resolution between CLX, AMD, and internal standards. A broad variety of organic solvents from various physicochemical categories with different volume fractions as well as combinations have been examined.
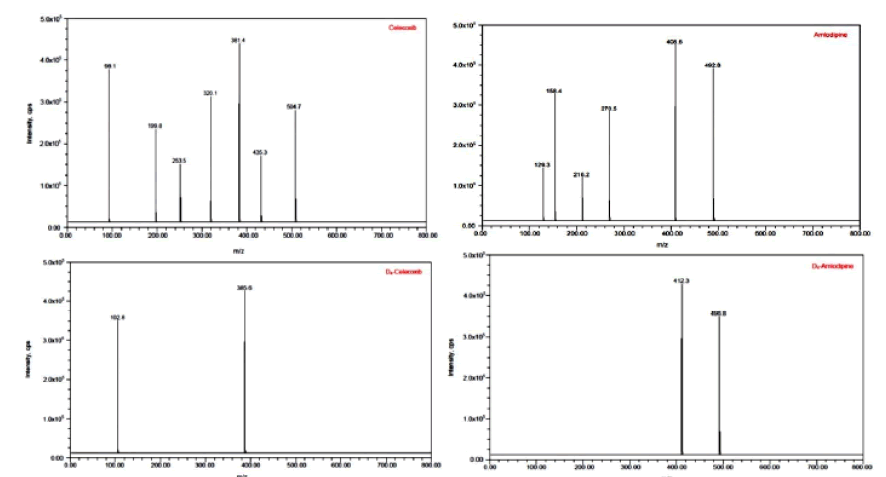
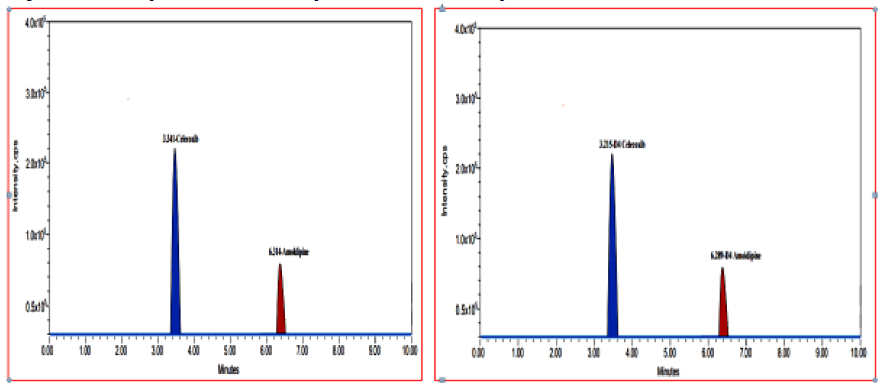
In terms of the quality of the analysis, different mobile phases were attempted to provide the best peak shape and less retention times with buffered and non-buffered mobile phases of varying concentrations. We have also tried using various normal phase packing columns. MS optimization was done by direct infusion of the solutions of CLX, AMD and their internal standards into the ESI source of the mass spectrometer. All the parameters in the ESI were optimized for better spray form that helps in better ionization of the analytes. The product ion spectrum was observed for CLX at m/z 504.7→98.1 and AMD at m/z 492.8→129.3. For the internal standards, CLX-D4 and AMD-D4 m/z value was found at m/z 385.6→102.8 and 496.8.5→412.3 respectively. Figures 2 and 3 illustrates the mass transition spectrums and multiple reaction monitoring (MRM) of the CLX and AMD and internal standards.
Figure 2: Product ion spectra of Celecoxib, Amlodipine, Celecoxib-D4 and Amlodipine-D4.
Figure 3: The multiple reaction monitoring (MRM) Chromatograms for Celecoxib & Amlodipine and Celecoxib- D4 & Amlodipine-D4.
Protein precipitation technique was chosen as the most precise method for the extraction analytes. The analytes were separated using acetonitrile–water mixture consisting of 0.1% formic acid buffer (70:30 v/v) as a mobile phase with a flow-rate of 1.0 mL/min and a run time of 10 minutes on an Agilent SB-C18 (250 mm × 4.6 mm; 3.5 μm) analytical column and good separation and elution were achieved using the proposed chromatographic conditions. Sensitivity and accuracy are the notable advantages of the developed method over the literature-based methods.
Selectivity and specificity
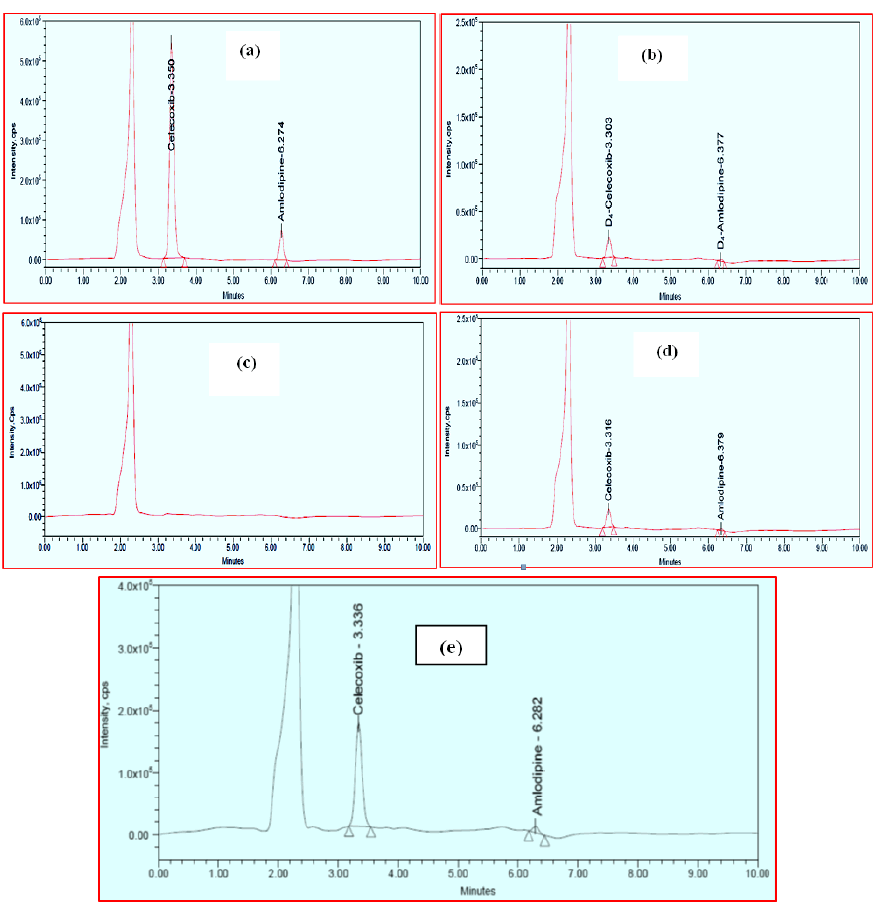
Figure 4 shows typical chromatograms of blank plasma, CLX and AMD spiked plasma (HQC), CLX and AMD spiked plasma (LLQC) and internal standards (CLX-D4 and AMD-D4) spiked plasma. CLX and CLX-D4 have retention times of 3.301 minutes and 3.306 minutes, whereas AMD and AMD-D4 have retention times 6.299 minutes and 6.293 minutes. There were no significant endogenous interfering peaks detected within the retention times of analytes and internal standards indicating the usefulness of this study. The variability of the analytes and internal standards peaks were lower, with percent of coefficient of variance (%CV) considerably below the permissible range of 5%. A total of ten minutes was required to complete a run. In the presence of additional plasma components, the approach was found to be very effective for separating and quantifying CLX and AMD. The results of selectivity and specificity are represented in Figure 4.
Figure 4: Chromatograms of: (a). Plasma spiked with Celecoxib and Amlodipine (HQC), (b). Specificity for plasma spiked with Celecoxib-D4 and Amlodipine-D4, (c). blank plasma, (d). Plasma spiked with Celecoxib and Amlodipine (LLQC), and (e). Celecoxib and Amlodipine from rat 6 h after oral administration of tablet dosage form.
Sensitivity (LLOQ)
The method offered an LLOQ of 20 ng/mL for CLX and 0.255 ng/mL for AMD in rat plasma. The %CV and % mean accuracy for both drugs were found to be 1.83%, 90.66% and 12.78%, 82.01% respectively. In the present study, both the LLOQs were sufficient for quantification.
Linearity and calibration curve
In the range of 20 ng/mL-800 ng/mL for CLX and 0.25 ng/mL-10.0 ng/mL for AMD, the calibration curves were found to be linear. The zero and blank samples were utilised to ensure that there was no interference. The following are the regression equations: Y=0.00173X-0.0025, r2=0.99908 for CLX, and Y=0.00189 × 0.199, r2=0.99916 for AMD where, X=Analyte concentration in ng/mL, Y=Peak area ratio of the analyte to the internal standards. Linear regression analysis was used to determine the r values, slopes, and intercepts. In every instance, back-calculated concentrations were within 15% of nominal concentrations.
Accuracy and precision
Intraday accuracy and precision were estimated using six samples on the same day, whereas inter-day accuracy and precision were assessed through repeated analysis over three days. The examination of the spiked plasma samples has revealed that intraday accuracy of the assay has varied between 87.91% and 100.27% with a precision (%CV) in the range of 0.08%–3.43% for CLX, while for AMD, the intraday accuracy has varied between 99.28% and 103.26% with a precision (%CV) of 1.92%-7.085%. The inter-day run accuracy was within the range of 87.91%-100.17% with %CV of 0.09%-3.53% for CLX and 97.74-103.28 accuracy and %CV of 1.36%-9.91% for AMD. Results of intra-day and inter-day assay accuracy and precision are displayed in Table 3.
| Studied drug | QC Level | Intra-day, n=6 | Inter-day, n=6×3 | ||||
|---|---|---|---|---|---|---|---|
| Mean conc. Found (ng/mL) | Accuracy (%) | %CV | Mean conc. Found (ng/mL) | Accuracy (%) | %CV | ||
| Celecoxib | LLOQC (20 ng/mL) | 17.59 | 87.91 | 3.43 | 17.56 | 87.81 | 3.53 |
| LQC (200 ng/mL) | 200.55 | 100.27 | 0.18 | 200.35 | 100.17 | 0.21 | |
| MQC (400 ng/mL) | 400.71 | 100.16 | 0.08 | 400.54 | 100.13 | 0.09 | |
| HQC (600 ng/mL) | 586.67 | 97.77 | 0.15 | 586.64 | 97.77 | 0.16 | |
| Amlodipine | LLOQC (0.25 ng/mL) | 0.244 | 97.83 | 9.84 | 0.244 | 97.76 | 9.91 |
| LQC (2.5 ng/mL | 2.582 | 97.83 | 3 | 2.582 | 103.28 | 3.13 | |
| MQC (5.0 ng/mL) | 5 | 100 | 1.37 | 5.008 | 100.16 | 1.36 | |
| HQC (7.5 ng/mL) | 7.446 | 99.28 | 1.32 | 7.443 | 99.24 | 1.38 | |
Note: n=3 days; 6 replicates per day
Table 3: Intra-day and inter-day precision and accuracy study results for the Celecoxib and Amlodipine.
Recovery and matrix effect
The recovery describes the efficiency of the separation of analytes from the samples. The mean recovery values were 99.47% and 100.97% with a precision (%CV) of 0.33 and 2.04 for CLX and AMD respectively. The data in Table 4 represents the efficiency of the extraction protocol introduced by the proposed method where the analyte recoveries were satisfactory and consistent. The matrix effect was evaluated for CLX and AMD at two QC levels (LQC and HQC). The results indicated that there was no significant matrix effect on the ionization (suppression or enhancement) of the analytes, exhibiting that the sample processing conditions used effectively removed any potential matrix interference. The results are summarized in Table 4.
| Parameter | QC Level | Celecoxib | Amlodipine | ||
|---|---|---|---|---|---|
| ≠ Mean % Recovery | % CV ≠ | ≠ Mean % Recovery | % CV ≠ | ||
| Recovery data | LQC | 100.33 | 0.16 | 101.09 | 3.15 |
| MQC | 100.19 | 0.06 | 101.09 | 1.57 | |
| HQC | 97.89 | 0.77 | 98.55 | 1.42 | |
| Matrix effect | LQC | 100.27 | 0.3 | 102.17 | 2.79 |
| HQC | 97.69 | 0.48 | 99.64 | 1.13 | |
Note: Mean percentage recovery and %CV were calculated using six lots of plasma samples
Table 4: Recovery and matrix effect study results for the Celecoxib and Amlodipine.
Dilution integrity
Dilution integrity is done to check if samples’ dilution would interfere with the accuracy and precision of results. The accuracy values for dilution integrity were found to be 97.89% and 97.68% for CLX and 98.55% and 98.68% for AMD. While %CV was 0.77% and 0.83% for CLX, it was 1.42% and 1.58% for AMD.
Auto sampler carryover
Carry-over was assessed and the results showed that there was no obvious signal response in the chromatographic profiles of blank plasma samples and internal standards (CLX-D4, AMD-D4) at the retention times of analytes. This suggested that carryover effect could be negligible in the LC analysis system including the injection needle, switching valve, column etc.
Stability experiments
The stability of CLX and AMD in rat plasma after exposure to various stress conditions was evaluated using stability studies, which revealed that the mean percent nominal values of the analytes were within 15% of the predicted concentrations for the analytes at their LQC, MC, and HQC levels. The results in Table 5 were within acceptable limits and demonstrated good stability of CLX and AMD.
| Sample | Celecoxib | Amlodipine | ||||||
|---|---|---|---|---|---|---|---|---|
| Spiked conc. (ng/mL) | Mean conc. Found (ng/mL) | % Mean Accuracy | % CV | Spiked conc. (ng/mL) | Mean conc. Found (ng/mL) | % Mean Accuracy | % CV | |
| Short term stability | 200 | 201.2 | 100.6 | 0.13 | 2.5 | 2.582 | 103.26 | 2.28 |
| 400 | 399.01 | 99.73 | 0.3 | 5 | 4.973 | 99.46 | 1.14 | |
| 600 | 584.89 | 97.49 | 0.05 | 7.5 | 7.492 | 98.91 | 0.76 | |
| Freeze and thaw stability | 200 | 204.42 | 102.21 | 0.41 | 2.5 | 1.17 | 86.78 | 6.96 |
| 400 | 399.68 | 99.92 | 0.13 | 5 | 4.538 | 90.76 | 3.86 | |
| 600 | 592.1 | 98.68 | 0.93 | 7.5 | 7.853 | 104.71 | 2.43 | |
| Auto sampler stability | 200 | 199.47 | 99.73 | 0.35 | 2.5 | 2.487 | 99.48 | 5.26 |
| 400 | 405.73 | 101.43 | 0.61 | 5 | 5.054 | 101.08 | 3.89 | |
| 600 | 586 | 97.66 | 0.41 | 7.5 | 7.011 | 93.48 | 9.08 | |
| Wet extract stability | 200 | 205.33 | 102.66 | 1.52 | 2.5 | 2.119 | 84.76 | 4.66 |
| 400 | 402.2 | 100.53 | 1.1 | 5 | 4.294 | 85.88 | 7.63 | |
| 600 | 586.47 | 97.75 | 0.43 | 7.5 | 6.716 | 89.54 | 9.2 | |
| Long Term Stability | 200 | 184.32 | 92.16 | 1.62 | 2.5 | 2.219 | 88.76 | 5.62 |
| 400 | 381.59 | 95.39 | 2.55 | 5 | 4.299 | 85.98 | 5.86 | |
| 600 | 565.02 | 94.16 | 0.488 | 7.5 | 6.596 | 87.94 | 4.206 | |
Note: Mean conc., % accuracy and %CV were calculated using six determinations
Table 5: Stability study results of the Celecoxib and Amlodipine by the proposed method.
Pharmacokinetic study
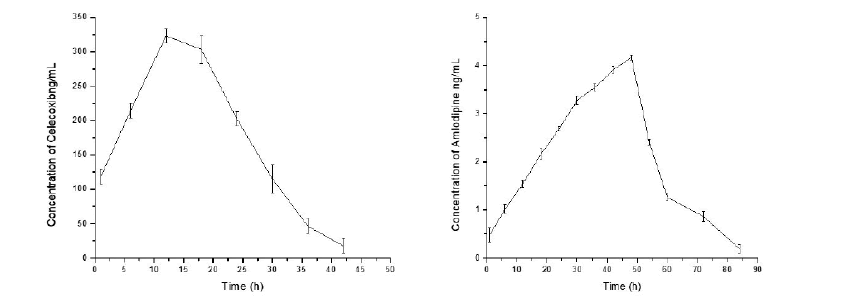
The area under the curve (plasma concentration) from initial time to 96 h (AUC0–96) was 7528.54 ± 21.1 ng h/mL for CLX and 171.97 ± 2.72 ng h/mL for AMD respectively. The maximum plasma concentration (Cmax) values were 323.1 ± 1.51 ng/mL and 4.16 ± 0.0531 ng/mL at the time (tmax) 12.0 h and 48 h, for CLX and AMD, respectively. The area under the curve (plasma concentration) from time zero to infinity (AUC0-α) was 7640 ± 29.7 ng h/mL and 174.52 ± 4.16 ng h/mL for CLX and AMD, respectively. The mean plasma concentration (± SD) of CLX and AMD vs time profile results are represented in Figure 5 and Table 6 respectively. The validated method was sensitive enough to accurately quantify both the analytes in plasma samples of a single dose pharmacokinetic study of CLX and AMD in experimental rats.
Figure 5: Mean plasma concentration-time profiles of Celecoxib and Amlodipine.
| Pharmacokinetic parameter | Celecoxib (Mean ± SD) | Amlodipine (Mean ± SD) |
|---|---|---|
| C max (ng/mL) | 323.1 ± 1.51 | 4.16 ± 0.0531 |
| T max (h) | 12 | 48 |
| AUC0-t (ng/mL × h) | 7528.54 ± 21.1 | 171.97 ± 2.72 |
| AUC0-∞ (ng/mL × h) | 7640 ± 29.7 | 174.52 ± 4.16 |
| t1/2 (h) | 4.42 ± 0.23 | 8.73 ± 1.6 |
| MRT (h) | 16.68 ± 0.03 | 38.41 ± 0.21 |
| CL/F (mL/min/kg) | 1.81 ± 0.00078 | 0.96 ± 0.02 |
| VZ/F(L/kg) | 0.69 ± 0.03 | 0.72 ± 0.11 |
Note: Cmax: peak plasma concentration; Tmax: time to reach peak plasma concentration; t1/2: terminal halfâ?life; CL/F: apparent total body clearance or oral clearance; AUC0–96: area under the plasma concentration–time curve from 0 to 96 hr; AUC 0â?∞: area under the plasma concentration–time curve from 0 hr to infinity; MRT: mean residence time; CL/F: apparent total body clearance or oral clearance; Vz/F: apparent volume of distribution.
Table 6: Pharmacokinetic parameters of Celecoxib and Amlodipine after oral administration.
Conclusion
A high throughput, sensitive, and reproducible LC-MS/MS method was developed and validated for the simultaneous quantification of CLX and AMD in rat plasma using relatively small sample volumes. The method was established precise and suitable to determine CLX and AMD in plasma samples of preclinical pharmacokinetic study in rats. The novelty of the method can be justified by unavailability of sensitive bioanalytical method like LC-MS for the studied combination. The method was able to quantify CLX and AMD even at a level of 20 ng/mL and 0.25 ng/mL before seven minutes. Hence, this reported method is applicable for the quantification of drugs in other types of biological matrices for preclinical or clinical use.
Acknowledgements
The authors are thankful to management of Vignan Pharmacy College, Vadlamudi, for providing all necessary facilities for carryout this research work.
Conflict of Interest
The authors declare no conflict of interest.
References
- P. Verdecchia, F. Angeli, G. Mazzotta, Martire P, M. Garofoli, et al. Treatment strategies for osteoarthritis patients with pain and hypertension, Ther Adv Musculoskeletal Dis, 2(2010):229-240.
- S.M. Smith, R.M. Cooper-DeHoff, Fixed-dose combination Amlodipine/Celecoxib (Concensi) for hypertension and osteoarthritis, Am J Med, 132(2019):172–174.
- F. Angeli, M. Trapasso, S. Signoretti, Amlodipine and celecoxib for treatment of hypertension and osteoarthritis pain, Expert Rev Clin Pharmacol, 11(2018):1073–1084.
- C. Walker, Are all oral cox-2 selective inhibitors the same? A consideration of Celecoxib, Etoricoxib, and Diclofenac, Int J Rheumatol, 2018(2018):1-12.
- S.E. Nissen, N.D. Yeomans, D.H. Solomon, T.F. Lüscher, P. Libby, et al. Cardiovascular safety of Celecoxib, Naproxen, or Ibuprofen for arthritis, N Engl J Med, 375(2016):2519–2529.
- F.K. Chan, A. Lanas, J. Scheinman, H. Nguyen, J.L. Goldsteinet, Celecoxib versus omeprazole and diclofenac in patients with osteoarthritis and rheumatoid arthritis (condor): A randomised trial, Lancet, 376(2010):173–179.
- Drugs and Diseases, Amlodipine/Celecoxib (Rx), Medscape
- D.S. Pathak, P.K. Pradhan, D.B. Meshram, H.A. Patel, UV spectroscopic method for simultaneous estimation of celecoxib and amlodipine, Pharmawave, 10(2017):48-58.
- D. Kushwaha, S. Diwakar, R.K Roy, S. Karole, H. Kushwaha, et al. Novel UV spectrophotometer methods for quantitative estimation of concensi (Amlodipine 10 mg and celecoxib 200 mg) using hydrotropic solubilizing agents, J drug deliv ther, 9(2019):651-655.
- A. Mahesh, K.V. Narayanswamy, B.E. Aldhubaib, N. SreeHarsha, A.B. Nair, Development of UV spectrophotometry methods for concurrent quantification of amlodipine and celecoxib by manipulation of ratio spectra in pure and pharmaceutical formulation, PLOS One, 14(2019):16.
- M. Attimarad, K.N. Venugopala, B.E. Aldhubiab, A.B. Nair, N. SreeHarsha, et al. Development of UV spectrophotometric procedures for determination of amlodipine and celecoxib in formulation: Use of scaling factor to improve the sensitivity, J Spectrosc, 2019(2019):1–10.
- M.M. Sharkawi, N.R. Mohamed, M.T. El-Saadi, N.H. Amin, Five spectrophotometric methods for simultaneous determination of Amlodipine besylate and celecoxib in presence of its toxic impurity, Spectrochim Acta A Mol Biomol Spectrosc, 263(2019):120-137.
- M. Rizk, S. Toubar, E. Ramzy, M. Helmy, Sensitive and validated TLC densitometry method coupled with fluorescence detection for quantitative determination of the newly co-formulated drugs, celecoxib and amlodipine besylate in tablet dosage form, Acta Chrom, 34(2021):150-161.
- S.N.B. Patel, B.R. Patel, A. Sharda, Analytical method development and validation of stability indicating rp-hplc method for estimation of amlodipine besylate and celecoxib in synthetic mixture, Inter J Adv Res, 7(2019):1066-1075.
- M.U. Maneesh, S.S. Ahmed, T.Y. Pasha, B. Ramesh, M. Majumder, A simple bioanalytical method for simultaneous estimation of amlodipine and celecoxib in rat plasma by high performance liquid chromatography, J Chromatogr Sci, 59(2021):627–633.
- A.A. Abraham, Analytical method development and validation of rp-hplc and hptlc methods for the simultaneous determination of amlodipine besylate and celecoxib in bulk and pharmaceutical dosage form, M Pharm thesis, The Tamil Nadu DR. M.G.R. Medical University,
- M.M.Z. Sharkawi, N.R. Mohamed, M.T. El-Saadi, N.H. Amin, Validated green chromatographic methods for determination of amlodipine and celecoxib in presence of methylacetophenone, Bioanalysis, 13(2021):969-83.
- U.S. Food, Drug Administration centre for drug evaluation and research (FDA), Bioanalytical method validation, Centre for Drug Evaluation and Research, 2018.
Copyright: © 2022 M. Mukkanti Eswarudu, et al. This is an open access article distributed under the terms of the Creative Commons Attribution License, which permits unrestricted use, distribution, and reproduction in any medium, provided the original work is properly cited.

