Research Article: Journal of Drug and Alcohol Research (2025) Volume 14, Issue 3
Identification of Impurities in the Drug Risankizumab Using RP-HPLC Method
U. Harini and S. Purnakala*S. Purnakala, Department of Pharmaceutical Analysis, Raghu College of Pharmacy, Dakamarri, Visakhapatnam, India, Email: raghupharma73@gmail.com
Received: 02-Jun-2025, Manuscript No. JDAR-25-167924; Editor assigned: 16-Jun-2025, Pre QC No. JDAR-25-167924; Reviewed: 30-Jun-2025, QC No. JDAR-25-167924; Revised: 01-Jul-2025, Manuscript No. JDAR-25-167924; Published: 28-Jul-2025, DOI: 10.4303/JDAR/236436
Abstract
Aim: To establish and validate a stability-indicating RP-HPLC method for the concurrent quantification of Risankizumab and its associated impurities in both bulk drug substances and pharmaceutical dosage forms.
Specific objectives:
• To develop a simple, rapid and specific RP-HPLC method for the estimation of Risankizumab and its impurities in bulk and combined pharmaceutical dosage forms.
• To validate the proposed methods in accordance with the analytical parameters mentioned in the ICH guidelines, such as system suitability, accuracy, precision, specificity, linearity, robustness, LOD and LOQ.
• To develop the method under the forced conditions such as acid, alkali, peroxide, reduction, thermal, hydrolysis and photo degradation.
A simple, rapid, precise, sensitive and reproducible Reverse Phase High Performance Liquid Chromatography (RP-HPLC) method has been developed for the quantitative analysis of Risankizumab and its impurities in pharmaceutical dosage form. Chromatographic separation of Risankizumab and its impurities was achieved on waters alliance-e2695, by using Luna Phenyl Hexyl 150 mm × 4.6 mm, 5 µ column and the mobile phase containing 0.1% TEA pH-2.5/OPA and Acetonitrile in the ratio of 80:20% v/v. The flow rate was 1 ml/min; detection was carried out by absorption at 263 nm using a photodiode array detector at ambient temperature. The number of theoretical plates for Risankizumab and its impurities was not less than 2000 and the tailing factor did not exceed 2. The % Relative Standard Deviation (%RSD) of peak areas across all measurements remained below 2.0. The developed method was validated in accordance with ICH guidelines. It proved to be a simple, cost-effective, precise, accurate, robust and suitable approach for the quantitative determination of Risankizumab and its impurities, as well as for conducting stability studies.
Keywords
HPLC; Risankizumab drug; Impurity-1; Impurity-2
Introduction
A drug’s Active Pharmaceutical Ingredient (API) is the component that, when combined with other ingredients, produces the drug’s desired pharmacological effect [1]. Such substances are generally called drug substances and used to formulate the drug product which are consumed by the patients. These pharmaceuticals provide pharmacological activity or some other direct action to influence the structure and function of the body for the purpose of diagnosis, cure, mitigation, therapy or prevention of illness. Thus, pharmaceutical sector has two demarcated sections, one is manufacturing of API’s and other is formulating them in the tablets, capsules, injectables, syrup, patches, etc. International Conference of Harmonization has adopted stringent rules to maintain quality of the API used in pharmaceutical product. Quality of the drug is nothing but compliance of the substance (API) with respect to set of quality parameters such as chemical purity, chemical assay, impurity profile, content of known and unknown and genotoxic impurities, inorganic contents, residual solvents, physical attributes such as polymorph, particle size, bulk density and etc. All these set of analytical examination is formatted together and formatted to release the material to end users is known as Certificate of Analysis (COA). Establishment of analytical chemist is multifold and critical during the period of product or process development. To assure the effectiveness, purity, stability and overall quality of API and developed therapeutic products, the pharmaceutical industry relies heavily on the work of analytical chemists [2]. Method validation of analytical methods is another milestone, which is critical to ensure that impurity levels are accurately and consistently reported throughout drug development.
Impurity profiling
Introduction to impurity profiling: Impurity profiling plays a crucial role in pharmaceutical analysis, focusing on the detection, characterization and measurement of impurities found in both active pharmaceutical ingredients and finished drug formulations. These impurities may arise during synthesis, formulation, storage or degradation.Understanding and controlling impurities is essential to ensure the safety, efficacy and quality of pharmaceutical products. Regulatory authorities like the ICH (International Council for Harmonisation) provide guidelines for acceptable impurity levels, making impurity profiling an integral part of drug development and quality control processes [3-5].
Drug profile of Risankizumab
Drug profile: Risankizumab
Generic name: Risankizumab-rzaa
Brand name: Skyrizi
Drug class: Humanized monoclonal antibody-Interleukin-23 (IL-23) inhibitor
ATC code: L04AC19
Molecular formula: C17H17N3O6S
Molecular weight: 391.0838 g/mol
Regulatory status
FDA approved: Yes (April 2019)
EMA approved: Yes
Prescription status: Rx-only
Mechanism of action: Risankizumab selectively binds to the p19 subunit of Interleukin-23 (IL-23), a cytokine involved in inflammatory and immune responses. By inhibiting IL-23, it downregulates the inflammatory pathway and reduces the release of pro-inflammatory cytokines and chemokines, which are implicated in conditions like psoriasis and inflammatory bowel disease (Figures 1-3 and Table 1).
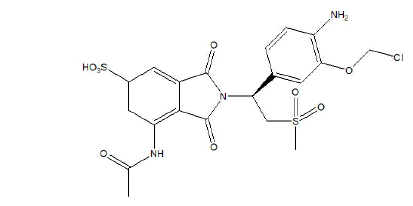
Figure 1: Molecular structure of Risankizumab
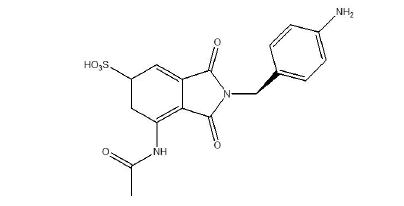
Figure 2: Molecular structure of impurity-1. Note: Drug profile of impurity-1 (Risankizumab impurity-1)
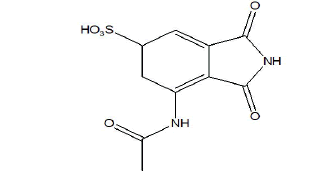
Figure 3: Molecular structure of Impurity-2. Note: Drug profile of impurity-2 (Risankizumab impurity-2)
| IUPAC name | 7-acetamido-2-((S)-1-(4-amino-3-(chloromethoxy)phenyl)-2-(methylsulfonyl)ethyl)-2,3,5,6-tetrahydro-1,3-dioxo-1H-isoindole-5-sulfonic acid |
|---|---|
| Molecular formula | C6476H9992N1720O2016S44 |
| Molecular weight | 145611.84 g•mol-1 |
| Description | Patients with moderate-to-severe plaque psoriasis who may also benefit from phototherapy (ultraviolet light treatment) are given an injection of Risankizumab-rzaa. Psoriasis plaques are persistent red spots covered with silvery white scales. |
| Therapeutic category | The monoclonal antibody Risankizumab-rzaa is a kind of drug. |
Table 1: Drug profile of Risankizumab
Uses of Risankizumab
In people whose plaque psoriasis is too severe to be treated with topical medicines alone, an injection of Risankizumabrzaa is used to alleviate the symptoms of the illness [6].
Interleukin-23 (IL-23) is a pro-inflammatory cytokine that plays a key role in the development of various chronic inflammatory disorders. Its interaction with the IL-23 receptor activates the IL-23/Th17 pathway, which regulates T-cell driven immune responses and inflammation. This activation leads to the release of pro-inflammatory cytokines and chemokines, such as IL-17 and supports the differentiation of Th17 and Th22 cells. Although the IL-23/Th17 pathway is essential for host defence against certain pathogens, it is also associated with the progression of chronic autoimmune inflammatory conditions. IL-23 consists of a unique p19 subunit and a p40 subunit, the latter of which it shares with IL-12. Risankizumab selectively targets and binds with high affinity to the p19 subunit of IL-23, effectively neutralizing its activity. By doing so, it prevents IL-23 from binding to its receptor and blocks the subsequent intracellular signalling events [7-10].
Materials and Methods
The basic parts of a HPLC instrumentation
The pump, injector, column, detector and data system make up the rest of the HPLC apparatus. A schematic diagram of a typical HPLC instrumentation is shown in Figure 4.
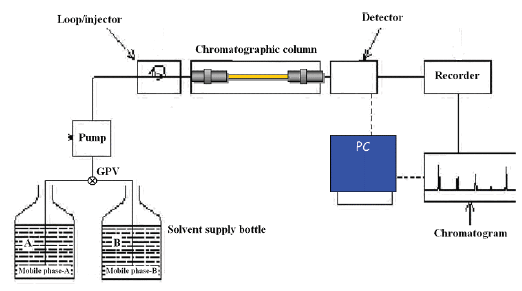
Figure 4: Basic HPLC instrumentation
Analytical methods/techniques used for impurity profiling study: The identification, characterization and quantification of impurities (including degradation products) in APIs and pharmaceutical formulations is a vital part of modern pharmaceutical analysis. Impurities in medications may pose serious health hazards, hence the employment of selective methods for identifying and determining impurities has recently gained popularity.
The separation, identification and determination of impurities to lowest possible level in drug substance are done by various techniques. The separation techniques include various chromatographic techniques. These methods rely on differential migration to separate many species present in a single sample. Different spectroscopic (mass spectrometry and nuclear magnetic resonance spectroscopy) and chromatographic (TLC, HPLC, GC, LCMS and GC-MS) methods are used nowadays for impurity profiling investigations in medicinal compounds. The types of contaminants and Active Pharmaceutical Ingredients (APIs) to be removed determine which methods may be used. The pharmaceutical business requires a method of quantifying contaminants in medicinal ingredients [11-13].
Results and Discussion
A Reverse-Phase High-Performance Liquid Chromatography (RP-HPLC) method was developed for the simultaneous estimation of Risankizumab and its impurities, utilizing a Luna Phenyl Hexyl column (250 × 4.6 mm, 5 × ¼m). The mobile phase consisted of 0.1% Triethylamine (TEA) adjusted to pH 2.5 with Orthophosphoric Acid (OPA) and mixed with acetonitrile in a ratio of 80:20 (v/v). The flow rate was maintained at 1.0 mL/min, with the column operated at ambient temperature. Detection was carried out at a wavelength of 263 nm.
Drugs samples
Glenmark was the source for both Risankizumab and its contaminants. Samples of Risankizumab from a commercial pharmaceutical formulation claiming to contain 15 mg were analyzed [14,15].
Method development
Selection of the wavelength for simultaneous estimation: Scanned absorption spectra of Risankizumab and its impurities informed the selection of the detection wavelength used in the creation of the test procedure. An accurately weighed 15 mg quantity of Risankizumab was transferred into a 10 mL volumetric flask. After dissolving the substance in a suitable buffer, the volume was brought up to the mark using the same solvent. This resulted in a stock solution with a concentration of 1500 µg/mL. From this stock, 1 mL was further diluted with solvent in another 10 mL volumetric flask to achieve the desired concentration. Put 5 milligrammes of impurity-1 and 5 milligrammes of impurity-2 into a 10 millilitre volumetric flask. Dissolve the chemical in 7 ml of diluent (mobile phase) and add more diluent until the desired volume is reached. Take 1 millilitre of the aforesaid solution and transfer it to a clean 10 millilitre volumetric flask, which should then be filled to the mark with diluent. Then, transfer 1 millilitre of the aforementioned solution to a 10 millilitre volumetric flask and dilute to the desired concentration. After setting up the auto sampler, we automatically injected the solution into the HPLC with PDA detector. Here is the obtained spectrum (Figure 5).
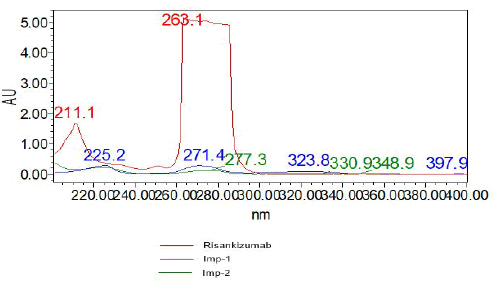
Figure 5: PDA spectrum
From the spectra shown above, the wavelength at which both medications exhibited highest absorbance was chosen. We settled on 263 nm as the optimal wavelength.
Selection of chromatographic method
The sample's composition, molecular weight and solubility all play a role in determining which chromatographic technique to use. Because medicines are so polar, the reverse phase chromatographic method was used for this investigation [16].
Trail-1
Chromatographic conditions:
• Column: Agilent Eclipse XDB (250 mm × 4.6 mm 5 µ
• Mobile phase: Acetonitrile and 0.1% formic acid (50:70)
• Injection volume: 10 µl
• Flow: µ1 ml/min
• Detection: PDA 200-400 nm (Figure 6 and Table 2)
| S. no | Name | RT | Area | USP resolution | USP tailing | USP plate count |
|---|---|---|---|---|---|---|
|
1 |
Risankizumab |
1.81 |
12856587 |
- |
1.29 |
833 |
|
2 |
Imp-1 |
11.407 |
972273 |
25.98 |
1 |
10893 |
|
3 |
Imp-2 |
13.381 |
1358308 |
4.3 |
1.06 |
12887 |
|
Note: The observed conditions for system appropriateness are beyond the allowed range |
||||||
Table 2: Results obtained from trail 1
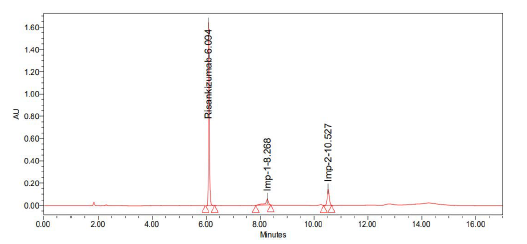
Figure 6: Graph obtained in trail 1
Trail-2
Chromatographic conditions:
• Column: Agilent eclipse XDB (250 mm × 4.6 mm 5 µ
• Mobile phase: Acetonitrile and 0.1% formic acid (40:60)
• Injection volume: 10 µ1
• Flow: 1 ml/min
• Detection: 263 nm (Figure 7 and Table 3)
| S. no | Name | Retention time | Area | USP resolution | USP tailing | USP plate count |
|---|---|---|---|---|---|---|
|
1 |
Risankizumab |
6.094 |
4723743 |
- |
1.29 |
106049 |
|
2 |
Imp-1 |
8.268 |
470478 |
15.03 |
2.16 |
52289 |
|
3 |
Imp-2 |
10.527 |
790108 |
19.12 |
1.01 |
83023 |
|
Note: Observation: Peak shape is not good |
||||||
Table 3: Results obtained from trail 2
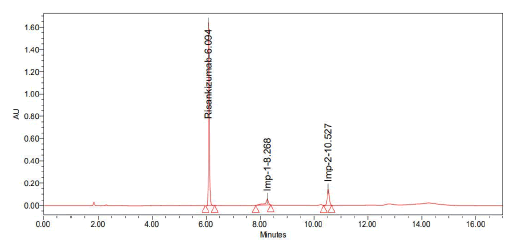
Figure 7: Graph obtained in trail 2
Trail-3
Chromatographic conditions:
• Column: Luna phenyl hexyl (250 mm × 4.6 mm, 5 µ
• Mobile phase: Acetonitrile and 0.1% formic acid (30:70)
• Injection volume: 10 µ1
• Flow: 1 ml/min
• Detection: 263 nm (Figure 8 and Table 4)
| S. no | Name | Retention time | Area | USP resolution | USP tailing | USP plate count |
|---|---|---|---|---|---|---|
| 1 | Risankizumab | 7.216 | 4971381 | - | 0.79 | 15159 |
| 2 | Imp-1 | 11.399 | 885211 | 16.08 | 0.99 | 11877 |
| 3 | Imp-2 | 11.882 | 1260859 | 2.28 | 0.73 | 25954 |
| Note: Observation: Unknown peaks are observed | ||||||
Table 4: Results obtained from trail 3
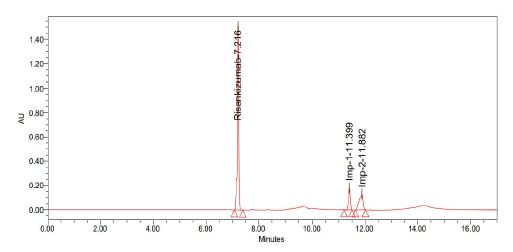
Figure 8: Graph obtained in trail 3
Trail 4
Chromatographic conditions
• Column: Luna phenyl hexyl (250 mm × 4.6 mm, 5 µ
• Mobile phase: Acetonitrile and 0.1% TEA pH-2.5/ OPA (10:90)
• Injection volume: 10 µ1
• Flow: 1 ml/min
• Detection: 263 nm (Figure 9 and Table 5)
| S. no | Name | Retention time | Area | USP resolution | USP tailing | USP plate count |
| 1 | Risankizumab | 9.595 | 542429 | - | 1.33 | 24571 |
| 2 | Imp-1 | 11.619 | 136207 | 4.22 | 1.21 | 17994 |
| 3 | Imp-2 | 12.917 | 122233 | 2.89 | 1.27 | 11870 |
| Note: Observation: Base line is not sufficient | ||||||
Table 5: Results obtained from trail 4
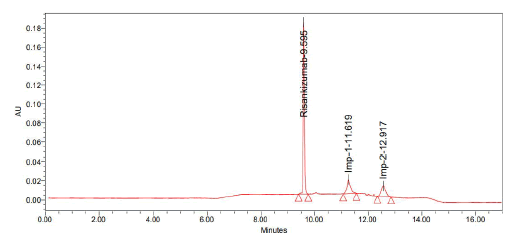
Figure 9: Graph obtained in trail 4
Trail-5
Chromatographic conditions
• Column: Luna phenyl hexyl (250 mm × 4.6 mm, 5 µ
• Mobile Phase: Acetonitrile and 0.1% TEA pH-2.5/ OPA (15:85)
• Injection Volume: 10 µ1
• Flow: 1ml/min
• Detection: 263 nm (Figure 10 and Table 6)
| S. No | Name | Retention time | Area | USP resolution | USP tailing | USP plate count |
|---|---|---|---|---|---|---|
| 1 | Risankizumab | 4.917 | 36987592 | - | 1.03 | 9123 |
| 2 | Imp-1 | 9.74 | 1362972 | 25.63 | 0.94 | 41704 |
| 3 | Imp-2 | 10.379 | 3582134 | 3.52 | 0.98 | 36916 |
| Note: Observation: Response of the peaks are very high | ||||||
Table 6: Results obtained from trail 5
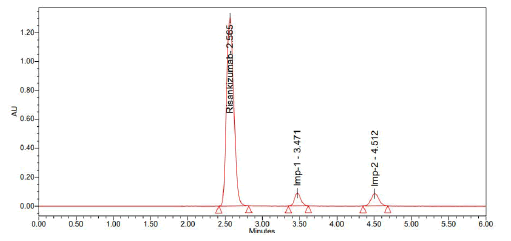
Figure 10: Graph obtained in trail 5
Trail 6 (Optimized chromatogram)
Chromatographic conditions:
• Column: Luna phenyl hexyl (250 mm × 4.6 mm, 5 µ
• Mobile phase: Acetonitrile and 0.1% TEA pH-2.5/ OPA (20:80)
• Injection Volume: 10 µ1
• Flow: 1 ml/min
• Detection: 263 nm (Figure 11 and Table 7)
| S. No | Name | RT | Area | USP resolution | USP tailing | USP plate count |
| 1 | Risankizumab | 2.565 | 8845928 | - | 1.17 | 15214 |
| 2 | Imp-1 | 3.471 | 531542 | 4.71 | 1.05 | 8602 |
| 3 | Imp-2 | 4.512 | 641033 | 6.23 | 1.20 | 13679 |
| Note: Observation: This technique may be used for validating hypotheses | ||||||
Table 7: Results obtained from trail 6
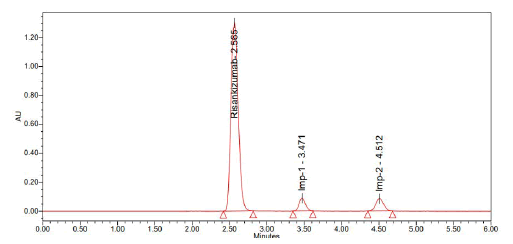
Figure 11: Graph obtained in trail 6
Inference: This experiment was optimised due to the positive outcomes and shorter retention period.
Optimized method
Preparation of mobile phase: The buffer and acetonitrile mixture was filtered and degassed and the final concentration was 80:20.
• Column: Luna phenyl hexyl (250 × 4.6 mm, 5 µ
• Injection volume: 10 µ1
• Wavelength: 263 nm
• Flow rate: 1.0 ml/ min
• Temperature: Ambient
• Diluent: Same as mobile phase
About 2.565, 3.471 and 4.512 minutes passed between doses of Risankizumab, Risankizumab impurity-1 and Risankizumab impurity-2, respectively (Figures 12-14).
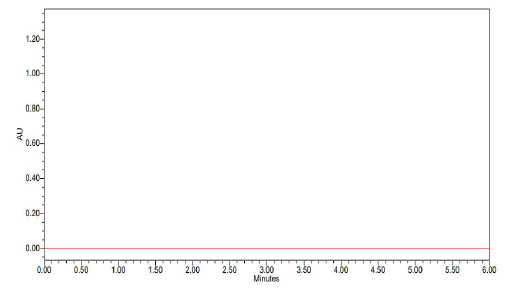
Figure 12: Chromatogram of blank
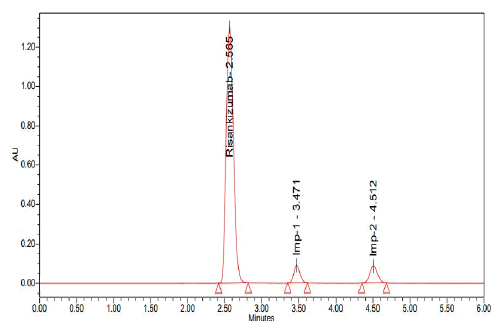
Figure 13: Chromatogram of standard
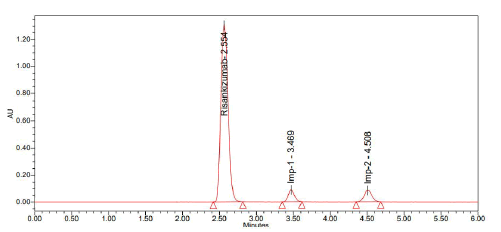
Figure 14: Chromatogram of sample
Method validation and its parameters
To confirm the suitability of the HPLC method for the quantification of Risankizumab, impurity-1 and impurity-2, various parameters were evaluated as per the established protocol. All validation studies were performed in compliance with ICH guidelines to ensure the method meets its intended analytical purpose [17-20].
Accuracy: The closeness of agreement between the value found and the true value or accepted reference value.
Precision: The closeness of agreement among a series of measurements obtained from multiple samplings of the same homogeneous sample.
It includes:
• Repeatability: Same analyst, same equipment, short time interval.
• Intermediate precision: Different days, analysts or equipment within the same lab.
• Reproducibility: Different labs.
Ruggedness: The degree of reproducibility of test results under normal, but variable, conditions such as different laboratories, analysts, instruments and environmental conditions.
Robustness: A measure of the method's capacity to remain unaffected by small but deliberate variations in method parameters.
Linearity: The ability of the method to produce results that are directly proportional to the concentration of analyte in the sample across a given range.
Limit of Detection (LOD): The lowest amount of analyte in a sample that can be detected, but not necessarily quantified, under stated experimental conditions [21-22].
Limit of Quantification (LOQ): The lowest amount of analyte in a sample that can be quantitatively determined with suitable precision and accuracy.
Specificity: The ability to assess the analyte unequivocally in the presence of components that may be expected to be present, such as impurities, degradants or matrix components.
Conclusion
A stability-indicating RP-HPLC method was successfully developed and optimized for the simultaneous estimation of Risankizumab and its impurities. Through systematic trials (Trail 1 to Trail 6), various chromatographic parameters were evaluated. Among them, Trail 6 provided optimal resolution, peak symmetry and retention times, demonstrating high precision and reproducibility. The method was validated following ICH guidelines by assessing key parameters such as accuracy, precision, specificity, linearity, robustness, as well as the Limits of Detection (LOD) and Limit of Quantification (LOQ). The use of Luna Phenyl Hexyl column and mobile phase containing 0.1% TEA pH 2.5/OPA and acetonitrile (80:20) resulted in clear separation with retention times of 2.565 min (Risankizumab), 3.471 min (impurity-1) and 4.512 min (impurity-2). This optimized method is simple, rapid and reliable, making it suitable for routine quality control and impurity profiling in pharmaceutical formulations.
Acknowledgements
The authors sincerely acknowledge Shree Icon Laboratories for providing the experimental data essential for this study. We also extend our gratitude to Raghu College of Pharmacy for their valuable backend support in facilitating the publication process.
Conflicts of Interest
The authors declare no conflict of interest.
Funding Clearance
There was no Funding.
References
- Z. Yaseen, M. Nandave, L. Sharma, Anti-diabetic biologicals: Exploring the role of different analytical techniques, Critical Rev Anal Chem, 6(2025):1-22.
- EI. El-Kimary, MA. Ragab, Recent analytical methodologies for the determination of omeprazole and/or its active isomer esomeprazole in different matrices: A Critical Review, Critical Rev Anal Chem, 52(2022):106-130.
- O. Kinzel, SD. Goldberg, MD. Cummings, C. Gege, C. Steeneck, et al., Identification of JNJ-61803534, a RORγt inverse agonist for the treatment of psoriasis, J Med Chem, 68(2025):8713-8728.
[Crossref] [Google Scholar] [PubMed]
- SH. Chan, K. Sheikh, MG. Zariwala, S. Somavarapu, Dry powder formulation of Azithromycin for COVID-19 therapeutics, J Microencapsula, 40(2023):217-232.
- A. Kumar, S. Jawla, G. Yadav, Recent analytical method developed by RP-HPLC, Glob J Pharmacol, 7(2013):232-240.
- CM. Du, K. Valko, C. Bevan, D. Reynolds, MH. Abraham, Rapid gradient RP-HPLC method for lipophilicity determination: A solvation equation based comparison with isocratic methods, Anal Chem, 70(1998):4228-4234.
- A. Kirthi, R. Shanmugam, MS. Prathyusha, DJ. Basha, A review on bioanalytical method development and validation by RP-HPLC, J Glob Tren Pharmaceu Sci, 5(2014):2265-2271.
- PN. Patel, G. Samanthula, V. Shrigod, SC. Modh, JR. Chaudhari, RPâHPLC method for determination of several NSAIDs and their combination drugs, Chromatog Res Int, 13(2013):242868.
- M. Zaj, L. Dobrowolski, G. Ziokowska, P. Zalewski, M. Piekarski, et al., Development and validation of RP HPLC method for determination of novel derivatives of Daunorubicin, Chem Anal, 54(2009):907-917.
- SS. Rane, A. Ajameri, R. Mody, P. Padmaja, Development and validation of RP-HPLC and RP-UPLC methods for quantification of erythropoietin formulated with human serum albumin, J Pharm Anal, 2(2012):160-165.
- U. Harini, AK. Pawar, A validated stability indicating LC-MS compatible RP-HPLC assay and dissolution methods for marketed formulation Stribild. J Drug Del Therap, 8(2018). [Google Scholar]
- U. Harini, U. Pilla, J. Panda, S. Patta, Development and validation of a novel rp-hplc method for impurity profiling of Isoproterenol hydrochloride. Biochem Cellular Arch, 25(2025).
- U. Harini, Akm. Pawar, Development and validation of stability indicating simultaneous uvspectrophotometric method for determination of emtricitabine, tenofovir disoproxil fumarate, cobicistat, and elvitegravir in pure and pharmaceutical dosage form. Asian J Pharm Clin Res, 11(2018):177.
- R. Sharma, S. Khanna, GP. Mishra, Development and validation of RPâHPLC method for simultaneous estimation of Ramipril, aspirin and atorvastatin in pharmaceutical preparations, J Chem, 9(2012):2177-2184.
- G. Sravanthi, KS. Gandla, L. Repudi, New analytical method development and validation for estimation of molnupiravir in bulk and tablet dosage form by RP-HPLC method, Cell Mol Biomed Rep, 3(2023):130-136.
- SJ. Joshi, PA. Karbhari, SI. Bhoir, KS. Bindu, C. Das, RP-HPLC method for simultaneous estimation of Bisoprolol fumarate and Hydrochlorothiazide in tablet formulation, J Pharm Biomed Anal, 52(2010):362-371.
[Crossref] [Google Scholar] [PubMed]
- KR. Naidu, UN. Kale, MS. Shingare, Stability indicating RP-HPLC method for simultaneous determination of amlodipine and benazepril hydrochloride from their combination drug product, J Pharm Biomed Anal, 39(2005):147-155.
[Crossref] [Google Scholar] [PubMed]
- R. Kalaichelvi, B. Thangabalan, DS. Rao, Validated RPâHPLC method for analysis of aripiprazole in a formulation, J Chem, 7(2010):827-832.
- J. Alvarez-Fuentes, L. Martin-Banderas, I. Munoz-Rubio, MA. Holgado, M. Fernandez-Arévalo, Development and validation of an RPâHPLC method for CB13 evaluation in several PLGA nanoparticle systems, The Sci World J, 12(2012):737526.
- S. Ghosh, S. Bomma, VL. Prasanna, S. Vidyadhar, D. Banji, S. Roy, Method development and validation of rilpivirine in bulk and tablet doses form by RP-HPLC method, Res J Pharm Technol, 6(2013):240-243.
- M. Gilar, P. Olivova, AE. Daly, JC. Gebler, Twoâdimensional separation of peptides using RPâRPâHPLC system with different pH in first and second separation dimensions, J Separa Sci, 28(2005):1694-1703.
[Crossref] [Google Scholar] [PubMed]
- S. Bhadra, SC. Das, S. Roy, S. Arefeen, AS. Rouf, Development and validation of RPâHPLC method for quantitative estimation of vinpocetine in pure and pharmaceutical dosage forms, Chromatograph Res Int, 11(2011):801656.
- K. Srinivasu, JV. Rao, NA. Raju, K. Mukkanti, A validated RPâHPLC method for the determination of Atazanavir in pharmaceutical dosage form, J Chem, 8(2011):453-456.
Copyright: © 2025 Harini U. This is an open access article distributed under the terms of the Creative Commons Attribution License, which permits unrestricted use, distribution and reproduction in any medium, provided the original work is properly cited.

