Research Article: Journal of Drug and Alcohol Research (2023) Volume 12, Issue 2
Formulation and Statistical Optimization of Pulsatile Drug Delivery System for Terbutaline Sulphate
Mohan Vikas1* and Chandu Babu Rao22Department of Pharmaceutical, Pridarshini Institute of Pharmaceutical Sciences, India
Mohan Vikas, Department of Pharmatical Sciences, Acharya Nagarjuna University, India, Email: mohanvikas@gmail.com
Received: 01-Mar-2023, Manuscript No. JDAR-23-96342; Editor assigned: 03-Mar-2023, Pre QC No. JDAR-23-96342 (PQ); Reviewed: 17-Mar-2023, QC No. JDAR-23-96342; Revised: 22-Mar-2023, Manuscript No. JDAR-23-96342 (R); Published: 29-Mar-2023, DOI: 10.4303/JDAR/236230
Abstract
In the present work it was aimed at developing chrono modulated drug delivery formulation for the treatment of nocturnal asthma. To determine the authenticity of the drug sample (Terbutaline sulphate), various physical, physicochemical and spectrophotometric methods were employed. UV and FTIR spectroscopy were used to verify the authenticity of the sample and the sample was found to be authentic. Drug polymer compatibility studies were conducted and no sign of physical compatibility was seen. The FTIR studies of physical mixture of the drug with different polymers showed no sign of interaction as the spectra of mixtures showed the peaks similar to pure drug spectra. UV spectroscopic method was selected as preferred analytical method for determination of terbutaline sulphate. Trial batches (preliminary) were formulated to study influence of polymer concentration on the physical properties and release profiles of the formulations. The final concentration of the polymers to be used in experimental design was fixed using the preliminary trial batches data.
Keywords
Terbutaline sulphate; Chrono modulated drug delivery; FTIR; DSC
Introduction
The use of medicines in curing diseases started very early in history. The ancient texts found in China and Egypt mention many types of remedies out of which some are considered useful till date [1]. As the science of medicine developed, the concept of homeostasis was solely used to treat diseases. This theory states that the occurrence of symptoms of a disease and response to medication does not depend on the time, day or month. This concept of homeostasis is being challenged by recent research in this field. The research in this field has shown that most human functions are organized in time and repeat after regular time intervals ranging from hours to days to months [2].
Chronobiology
Chronobiology is defined as the study of Biological Rhythms (BR) mechanisms behind them. From the ancient time, relation between time and biological functions had been studied. Circadian means showing rhythmic behavior. Many biological functions such as nerve impulse, heartbeat, sleep and menstrual cycles show rhythmic behavior. The time between each repetition of such biological functions is called as a period. Usually, the Circadian Rhythms (CR) have a period of 20 h to 28 h between each repetition. BR in humans and animals has been documented by a large number of studies published in respected scientific journals [3-5].
Mechanisms of biological time-keeping
Master Biological Clock, the Suprachiasmatic Nuclei (SCN)
Mechanisms of biological time-keeping
Master clock which comprises of paired SCN present in the pineal and hypothalamus gland control the BR [6-9]. The time keeping system (responsible for rhythmic activities) is made of various genes and their gene products (Clock genes, Per1, Per2, Per3, Bmal, Clock and Cry). The expression of clock genes (Cry1, Cry2, Per1, Per2) is done by transcription factors such as CLOCK and BMAL1. Circadian rhythm in the expression of the CLOCK: BMAL1 driven clock and clock-controlled genes is controlled by negative feedback of proteins PER and CRY. Rhythm stabilization is controlled by feedback loops, which include genes Rev-erba and Rora. The 24-hour night dark cycle also affects the precision of period of CR by modulation (post-translational) of clock proteins [10]. The peripheral circadian clocks which are located in other parts of body (cells, tissue and organs) are also controlled by master SCN. The output given by both the central and peripheral clocks is harmonized by clock-controlled genes leading to making of Circadian Time Structure (CTS). The biological time-keeping system also includes the multitude of peripheral circadian clocks located in cells, tissues and organs, which are regulated by the master SCN clock [11]. The output of the central and peripheral circadian clocks is mediated by various clock-controlled genes, giving rise to the body’s CTS.
Drug delivery systems for chronotherapeutic delivery of drugs
Chronotherapy of nocturnal asthma requires either constant plasma drug concentration maintenance throughout the night for patients having attacks at any time during night or delivery of drug during morning hours for patients having asthma attacks only during morning hours. To meet such requirements both type of systems have been formulated. Pulsatile drug delivery systems release drug quickly after a time gap known as lag time to match the circadian rhythm of a disease [12]. Various external signals or stimuli can start the release of drug from pulsatile systems such as chemical, magnetic, thermal and electrical stimuli and also the start of release can be regulated by time period as in time-controlled devices.
Advantages of pulsatile delivery
• Reduced side effects.
• The daytime or night-time activity is extended.
• Dosing frequency is reduced.
• The dose size is reduced.
• More suitable for patients.
• As the numbers of doses are less, overall cost of treatment is reduced.
• Drug more suitably adapts to CR of diseases and body functions.
• Specific sites such as colon can be targeted.
• As some drugs can be released in colon the stomach mucosa is protected from drugs which irritate.
• As the drugs are released in colon the hepatic first pass is prevented increasing bioavailability.
Various types of pulsatile drug delivery systems
Formulations dependent on release-controlling coatings: In such formulations the solid core (active ingredient) is coated with polymers which can affect the time of the release of active ingredient. Single or multi-units can be formulated into the core. Multiple units have advantages as they offer consistent release due to low effect of gastric residence time. Depending upon the type of polymer used in coating the release of drug can be categorized into various mechanisms.
a) Erodible systems: In these systems core is coated with a hydrophilic polymeric coating of an adequate thickness which when exposed to gastric fluid, swells, dissolves or erodes. This leads to delay in the release of active ingredient form the formulation. The type of polymer, its coating level and concentration effects the lag time. Hydrophilic polymers (cellulose derivatives), such as hydroxypropylcellulose, hydroxyethylcellulose, andhydroxy propylmethylcellulose and are mostly used due to versatile properties and established safety.
b) Rupturable systems: In these systems desired lag time is achieved by the liberation of the active pharmaceutical ingredient by the breaking of films, which are moderately permeable to water. These films are made of water insoluble polymers and sometime pore formers are also added. As the water enters into the core due to osmotic pressure the swellable polymer in the core swells leading to the rupturing of the film leading to release of active ingredient. The composition and thickness of the coating controls the time of drug release.
c) Diffusive reservoir systems: In these systems polymeric films with increasing permeability made of Eudragit® RS are applied to a core containing the active ingredient. These systems show sigmoidal release pattern due to the fact that initially the diffusion of water into the core is limited, which cause partial ionization of the organic acid present in the in between layer.
Delivery systems based on release-controlling plugs
In such systems an impermeable capsule shell body is sealed with a hydrophilic plug which when comes in contact with water swells leading to its expulsion. After the complete removal of plug the drug is released. The lag time is dependent upon the composition of plug material. Various erodible hydrophilic polymers, such as HPMC, PEO, sodium alginate, PVA and guar gum are used to make plug and the insoluble capsule shell is made of formaldehyde treated gelatin or ethyl cellulose.
Delivery systems based on osmotic pumping
In this system the core is made of 2 parts divided by a partition. One part contains active ingredient and other part contains expanding polymers. The core completely encapsulated in semi-permeable film coat. Holes are made in this shell-using laser. These holes connect the drug with the dissolution medium. The release can be further delayed by interposing a hydrophilic coat between the core and the outer membrane. When water enters into the core the drug dissolves and is pushed at a constant rate out by the swellable polymer through the laser-drilled hole.
Materials
Terbutaline sulphate, HPMC K15M, Avicel PH-101 were procured from Oscar Remedies Pvt. Ltd. Haryana, India. Ethyl cellulose, Ac-Di-Sol, Sodium starch glycolate, Avicel PH-101, Lactose, Talc were obtained from Nice Chemicals Pvt. Ltd. Kerala, India. All other ingredients were also analytical grade.
Methods
Drug analysis
Analysis of Terbutaline sulphate was done to identify the obtained sample. Organoleptic properties of the pure drug were found out. Melting point, solubility and partition coefficient of the drug were determined.
Determination of melting point
Capillary fusion method was used to determine the melting point of Terbutaline sulphate using Remi’s melting point apparatus. Melting point was noted and verified from literature value.
Determination of absorption maxima (λmax) for analysis
Solution of Terbutaline sulphate was prepared in the buffer pH 1.2. λmax was determined by scanning between 200 nm-400 nm, using UV spectrophotometer. The scanned λmax values were compared with literature value (Clarkes Analysis of drugs and poisons).
Fourier transform infrared analysis
The FTIR analysis is used to compare drug sample with a pure authentic sample. The data is used to verify the purity of the sample drug. 3 mg-5 mg of drug sample was taken and grinded with KBr and compacted into a pellet. The pellet was analyzed in the spectrophotometer in wavelength 4000 cm-1 to 400 cm-1.
Calibration curve
Calibration curve of Terbutaline sulphate in Hydrochloric acid buffer (pH 1.2) and phosphate buffer (pH 6.8). Calibration curve was plotted in a range of 2 μg/ml-18 μg/ml. Absorbance was determined using UV-Visible spectrophotometer at 276 nm.
Solubility study
The solubility of Terbutaline sulphate was determined in water. A definite but excess quantity (1500 mg) of drug was dissolved in 5 ml of distilled water in 10 ml volumetric flasks. The drug was dissolved using a shaker water bath at Experimental design for formulating fast release tablet. The UV absorbance of the solution after appropriate dilutions was determined at 276 nm using UV spectrophotometer and the amount of drug dissolved was calculated using calibration curve.
Partition co-efficient
A major criterion in evaluation of the ability of a drug to penetrate the lipid membrane is its apparent oil/water partition coefficient (K o/w). The partition coefficient of Terbutaline sulphate was determined in n-octanol: Phosphate buffer pH 7.4. 10 mg of Terbutaline sulphate was added to 10 ml of n-octanol: Phosphate buffer pH 7.4 (1:1), in a separating funnel and shaken. Both the layers were separated and the analysis of the Terbutaline sulphate, which was solubilized in aqueous phase, was determined by measuring the absorbance at 276 nm using UV spectrophotometer. Partition coefficient of Terbutaline sulphate was calculated using equation (1). The partition coefficient value was calculated and compared with literature value.
Po/w = (C oil/C water) equilibrium (1)
Drug polymer interaction studies
The drug polymer interaction was studied. Desired quantity of drug with specified excipients (HPMC 15M, Carbopol 971P, Ac-Di-Sol and Ethyl cellulose) were taken in the ratio 1:1 and 1:5 and mixed thoroughly and filled in dried vials. The vials were sealed and kept at 45ºC for 2 weeks. The vials were examined daily at regular interval for discoloration, clump formulation and liquefaction. The FTIR analysis was done in a range between 400 cm-1-4000 cm-1. The obtained spectra were then studied for difference in the peaks obtained by comparing with the spectra of pure drug.
Formulation of fast-release tablets
The direct compression technique was used for tablet preparation. All the raw materials were passed through a#60 (0.250 mm) sieve before mixing (Table 1). Terbutaline sulphate, sodium starch glycolate, Ac-Di-Sol, lactose and Avicel PH-101. The blending was done employing a laboratory mortar and pestle. The powder blend was lubricated with 2% talc and 2% magnesium stearate. The powder blend (100 mg) was compressed using a 6-mm tooling punch on a single punch tablet machine.
| Ingredients | TF1 | TF2 | TF3 | TF4 | TF5 | TF6 | TF7 | TF8 | TF9 | TF10 | TF11 | TF12 | TF13 | TF14 | TF15 | TF16 |
|---|---|---|---|---|---|---|---|---|---|---|---|---|---|---|---|---|
| Terbutaline Sulphate | 2 | 2 | 2 | 2 | 2 | 2 | 2 | 2 | 2 | 2 | 2 | 2 | 2 | 2 | 2 | 2 |
| Ac-Di-Sol | 1 | 2 | 3 | 4 | 5 | 6 | 0 | 0 | 0 | 0 | 0 | 0 | 1 | 3 | 6 | 9 |
| Sodium starch glycolate | 0 | 0 | 0 | 0 | 0 | 0 | 1 | 2 | 3 | 4 | 5 | 6 | 1 | 3 | 6 | 9 |
| Avicel PH -101 | 30 | 30 | 30 | 30 | 30 | 30 | 30 | 30 | 30 | 30 | 30 | 30 | 30 | 30 | 30 | 30 |
| Lactose | 63 | 62 | 61 | 60 | 59 | 58 | 63 | 62 | 61 | 60 | 59 | 58 | 62 | 58 | 52 | 46 |
| Magnesium stearate | 2 | 2 | 2 | 2 | 2 | 2 | 2 | 2 | 2 | 2 | 2 | 2 | 2 | 2 | 2 | 2 |
| Talc | 2 | 2 | 2 | 2 | 2 | 2 | 2 | 2 | 2 | 2 | 2 | 2 | 2 | 2 | 2 | 2 |
Table 1: Composition of preliminary trial batches of Terbutaline sulphate fast-release tablet formulation (Batches TF1-TF16 in %w/w)
Pre-compression characterization of FRT powder blends
The powder blends of FRT were evaluated for flow properties, which included Hausner’s ratio, bulk density, compressibility index, tapped density, and angle of repose. Study of these properties is essential as poor flow properties can cause problem of powder not flowing from hopper into the die, which makes it impossible to work on rotary tabletting machines.
Bulk density (ρb)
A weighed amount (M) of powder blend was added to a graduated measuring cylinder and its volume (Vb) was found.
Compressibility index (I)
Compressibility index is an indication of flow properties of powder less is the value of co.
Hausner’s ratio (HR)
It indicates flow properties of powder blend. Lower value of Hausner’s ratio (<1.25) is an indicator of better flow properties, compressibility index better is the flow and vice versa.
Angle of repose (θ)
Angle of Repose is also an indicative of flow properties, values of <25 means excellent flow properties and values of >40 are indicative of poor flow properties.
Post-compression characterization
Formulated FRT were tested for characteristics like thickness, friability, hardness, drug content, disintegration time and in vitro release studies.
General appearance
Tablets were evaluated for tablet’s size, colour, shape, odour, surface texture, physical flaws.
Tablet thickness
Thickness of 10 units (tablets) was measured using Vernier caliper.
Weight variation
Tablets were evaluated for weight variation. As per USP, 20 tablets were taken and weighed separately, then their mean weight was determined, and the individual tablet weights were compared to the mean weight for weight variation.
Hardness
Pfizer hardness tester was used to check hardness of the tablets.
Friability
Tablets were evaluated for friability using Roche friabilator. In this test, the tablets are subjected to abrasions and shock.
Drug content
FRT were evaluated for drug content. 10 tablets from each formulation batch were weighed powdered. Then powder equivalent to 2 mg was dissolved in 0.1N HCl and drug content was determined spectrophotometrically at 276 nm.
Disintegration time
USP-27/NF-22 disintegration test apparatus was used for this test and standard method was followed.
Experimental design for formulating fast release tablet
32 design was used. In accordance to this design total nine experiments were done. This design consists of dependent variables Y and independent or controlled variables X1 and X2. The 2 independent formulation variables selected for this study were X1, amount of Ac-Di-Sol; and X2, amount of Sodium starch glycolate. The independent variables were varied at 3 levels. The levels for these 3 parameters were determined from the preliminary trials. The dependent variables were Y1 i.e., disintegration time in seconds; Y2 i.e., friability in %weight. Tables 2 and 3 summarize the factors, the levels tested, and the actual values of the coded variables.
| Batches | Variable Levels in Coded Form | |
|---|---|---|
| X1 | X2 | |
| F1 | -1 | -1 |
| F2 | -1 | 0 |
| F3 | -1 | +1 |
| F4 | 0 | -1 |
| F5 | 0 | 0 |
| F6 | 0 | +1 |
| F7 | +1 | -1 |
| F8 | +1 | 0 |
| F9 | +1 | +1 |
Table 2: Factors combinations as per the chosen experimental design for formulating FRT X1: Ac-Di-Sol, X2: Sodium starch glycolate
| Coded values | Actual values (% w/w) | |
|---|---|---|
| X1 (% w/w) | X2 (% w/w) | |
| -1 | 2 | 2 |
| 0 | 4 | 4 |
| +1 | 6 | 6 |
Table 3: Actual values of coded variables for formulating FRT X1: Ac-Di- Sol, X2: Sodium starch glycolate
Method of preparation of FRT
The direct compression technique was used for tablet preparation. All the raw materials were passed through a#60 (0.250 mm) sieve before mixing (Table 4). Terbutaline sulphate, sodium starch glycolate, Ac-Di-Sol, lactose and Avicel PH-101were blended using a laboratory mortar and pestle. The powder blend was lubricated with 2% talc and 2% magnesium stearate. The powder blend was compressed on a single punch tablet machine.
| Ingredients (mg) | F1 | F2 | F3 | F4 | F5 | F6 | F7 | F8 | F9 |
|---|---|---|---|---|---|---|---|---|---|
| Terbutaline Sulphate | 2 | 2 | 2 | 2 | 2 | 2 | 2 | 2 | 2 |
| Ac-di-sol | 2 | 2 | 2 | 2 | 2 | 2 | 2 | 2 | 2 |
| Sodium starch glycolate | 2 | 4 | 6 | 2 | 4 | 6 | 2 | 4 | 6 |
| Avicel PH-101 | 30 | 30 | 30 | 30 | 30 | 30 | 30 | 30 | 30 |
| Lactose | 60 | 58 | 56 | 58 | 56 | 54 | 56 | 54 | 52 |
| Magnesium Stearate | 2 | 2 | 2 | 2 | 2 | 2 | 2 | 2 | 2 |
| Talc | 2 | 2 | 2 | 2 | 2 | 2 | 2 | 2 | 2 |
Table 4: Composition of Terbutaline sulphate fast-release tablet formulations (Batches F1-F9 in mg)
Response surface and statistical analysis of model
2-D contour plots and 3-D response surface plots were plotted to study the effect of independent variables on dependent variables. ANOVA and Lack-of-fit test analysis were done for the model to identify insignificant factors.
Optimization of FRT
By using the quadratic equation obtained from factorial design optimized tablets were manufactured with DT targeted to 30 s and friability in a range between 0.42%-0.96% (Table 5).
| Constraints | |||
|---|---|---|---|
| Na Response surface and statistical analysis of model 2-D contour plots and 3-D response surface plots were plotted to study the effect of independent variables on dependent variables. ANOVA and Lack-of-fit test analysis were done for the model to identify insignificant factors. Optimization of FRT By using the quadratic equation obtained from factorial design optimized tablets were manufactured with DT targeted to 30 s and friability in a range between 0.42%-0.96% |
Goal | Lower limit | Upper limit |
| X1-Acdisol | is in range | -1 | +1 |
| X2-SSG | is in range | -1 | +1 |
| DT (s) | is target=30 | 23 | 88 |
| Friability (%) | is in range | 0.42 | 0.96 |
Table 5: Optimization of FRT
Evaluation of optimized batch of FRT
For verifying, the model for its ability to predict 3 batches of the optimized batch were prepared, and evaluation was done.
Results and Discussion
Drug analysis
Drug (Terbutaline sulphate) sample was analysed using various physical, physicochemical and spectrophotometric methods. The sample was a white powder which was confirmed by the literature. From the analysis of the drug using various physical and spectrophotometric methods it was inferred that the obtained drug sample was pure as shown in Figures 1-4.

Figure 1: Diagram of the delivery system having erodible coatings

Figure 2: Outline of the delivery system with rupturable coating layers

Figure 3: Outline of the mechanism of the release-controlling plug based drug delivery system
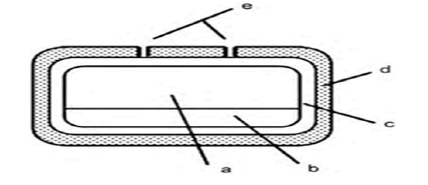
Figure 4: Outline of osmotic drug delivery system: (a) Drug formulation,
(b) swelling polymeric compartment, (c) hydrophilic polymeric coating,
(d) osmotic membrane and (e) laser-drilled orifices
Melting point of the drug
The melting point is given in Table 6 the λmax were found to be 202 nm and 276 nm which matches the values given in literature. UV absorption spectra are shown in Figure 5.
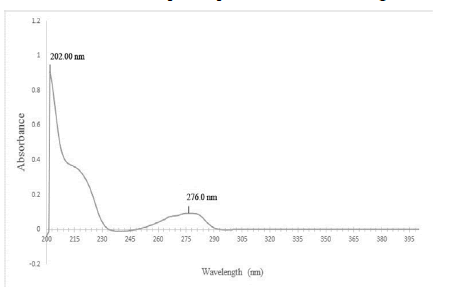
Figure 5: UV absorption spectra of Terbutaline sulphate in buffer pH 1.2
| Method used | Experimental value | Literature value100 |
|---|---|---|
| Capillary fusion method | 246˚C-249˚C | 246˚C-248˚C |
Table 6: Melting point analysis data
FTIR spectra of the drug
FTIR spectroscopy was used to verify the authenticity of the sample and from the obtained spectra it was inferred that characteristic peaks obtained (3300 cm-1-OH stretch, 3050 cm-1-aromatic CH stretch, 1200 cm-1 phenolic C-O stretch, 1610 cm-1-aromatic ring stretch) were concordant with literature (Figure 6).
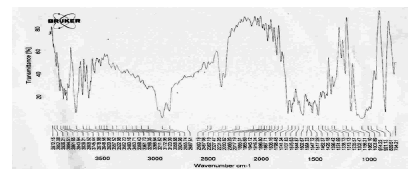
Figure 6: FTIR Spectra of Terbutaline sulphate Calibration curve
Calibration curve
Calibration curves were prepared in a concentration range of 2 μg/mL-20 μg/mL and straight lines were obtained as shown in Figures 7 and 8. The equations of straight lines were found to be y=0.0085-0.0005 and y=0.0085x-0.001 for buffer pH 1.2 and 6.8 respectively (Tables 7 and 8).
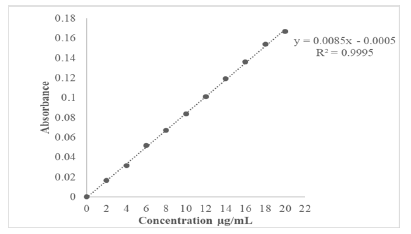
Figure 7: Calibration Curve of Terbutaline sulphate in Hydrochloric acid buffer pH 1.2
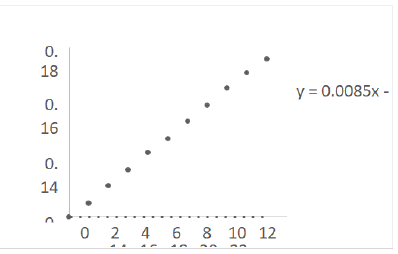
Figure 8: Calibration Curve of Terbutaline sulphate in phosphate buffer pH 6.8
| S. No. | Concentration(µg/mL) | Absorbance in pH 1.2 | Absorbance in pH 6.8 |
|---|---|---|---|
| 1 | 2 | 0.0168 | 0.0143 |
| 2 | 4 | 0.0314 | 0.0331 |
| 3 | 6 | 0.0517 | 0.0502 |
| 4 | 8 | 0.0672 | 0.0683 |
| 5 | 10 | 0.0838 | 0.0832 |
| 6 | 12 | 0.1013 | 0.1016 |
| 7 | 14 | 0.1193 | 0.1189 |
| 8 | 16 | 0.1363 | 0.1373 |
| 9 | 18 | 0.154 | 0.1534 |
| 10 | 20 | 0.1671 | 0.1679 |
Table 7: Calibration data of Terbutaline sulphate in Hydrochloric acid buffer pH 1.2 and phosphate buffer pH 6.8
| S. No | Parameters | Value in pH 1.2 | Value in pH 6.8 |
|---|---|---|---|
| 1 | Equation of straight line | y=0.0085x-0.0005 | y=0.0085x-0.001 |
| 2 | Regression Coefficient | 0.9995 | R²=0.9996 |
Table 8: Statistical Parameters related to calibration curve in Hydrochloric acid buffer pH 1.2 and phosphate buffer pH 6.8
Solubility study
Drug was freely soluble in water and had a solubility of 212.3 mg/ml (Table 9).
| S. No | Media | Solubility (mg/mL) |
|---|---|---|
| 1 | Distilled Water |
|
Table 9: Quantitative Solubility of Terbutaline sulphate in water at Room Temperature
Partition coefficient
The partition coefficient of the drug was found to be 0.87 which was similar to value given in literature (Table 10).
| S. No | Method | Experimental | Literature value99,100 |
|---|---|---|---|
| 1 | n-octanol partition coefficient |
0.87 ± 0.058 | 0.9 |
Table 10: Partition coefficient of Terbutaline sulphate
Drug polymer interaction studies
The drug polymer compatibility studies showed that drug is compatible with all the polymers and therefore drug and polymers can be used to make formulations.
FTIR analysis for drug polymer interaction studies
The FTIR studies of physical mixture of the drug with different polymers showed no sign of interaction as the spectra of mixtures showed the peaks similar to the pure drug spectra (Figures 9-13).

Figure 9: FTIR Spectra of Terbutaline sulphate

Figure 10: FTIR Spectra of physical mixture of Terbutaline sulphate and HPMC K15M
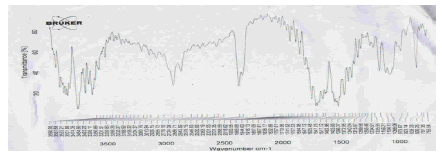
Figure 11: FTIR Spectra of physical mixture of Terbutaline sulphate and Carbopol 971P
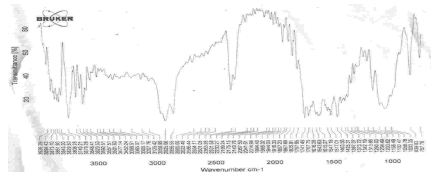
Figure 12: FTIR Spectra of physical mixture of Terbutaline sulphate and Ethyl cellulose
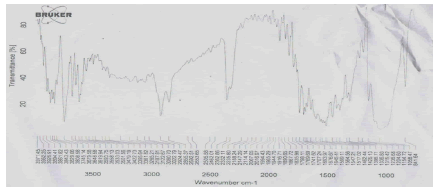
Figure 13: FTIR Spectra ofphysical mixture of Terbutaline sulphate and Ac-Di-Sol
Preliminary studies for formulating FRT of Terbutaline sulphate
A total of 16 Preliminary trial batches were manufactured to check the result of concentration of super disintegrants on various physical properties of the manufactured tablets. In batches TF1-6 the concentration of Ac-Di-Sol was varied from 1-6%w/w while in batches TF7-12 concentration of sodium starch glycolate was varied from 1% w/w-6%w/w. Batches TF13-16 were combination batches having both the super disintegrants (Table 11).
| Batches | BD (gm/cc) | TD (gm/cc) | CI (%) | HR | AOR (°) |
|---|---|---|---|---|---|
| TF1 | 0.431 ± 0.032 | 0.481 ± 0.016 | 10.395 ± 1.23 | 1.116 ± 0.045 | 22.02 ± 0.218 |
| TF2 | 0.425 ± 0.025 | 0.476 ± 0.028 | 10.714 ± 2.45 | 1.120 ± 0.037 | 23.91 ± 0.341 |
| TF3 | 0.419 ± 0.022 | 0.473 ± 0.018 | 11.416 ± 3.56 | 1.128 ± 0.014 | 23.71 ± 0.242 |
| TF4 | 0.413 ± 0.037 | 0.471 ± 0.031 | 12.314 ± 2.31 | 1.140 ± 0.034 | 22.63 ± 0.561 |
| TF5 | 0.408 ± 0.012 | 0.468 ± 0.036 | 12.820 ± 3.67 | 1.147 ± 0.026 | 24.35 ± 0.378 |
| TF6 | 0.402 ± 0.038 | 0.462 ± 0.024 | 12.987 ± 1.22 | 1.149 ± 0.017 | 22.27 ± 0.217 |
| TF7 | 0.433 ± 0.025 | 0.483 ± 0.021 | 10.351 ± 2.89 | 1.115 ± 0.032 | 22.56 ± 0.341 |
| TF8 | 0.426 ± 0.025 | 0.478 ± 0.037 | 10.878 ± 1.47 | 1.122 ± 0.024 | 23.3 ± 0.165 |
| TF9 | 0.421 ± 0.015 | 0.477 ± 0.016 | 11.740 ± 4.26 | 1.130 ± 0.016 | 22.4 ± 0.349 |
| TF10 | 0.416 ± 0.034 | 0.474 ± 0.023 | 12.236 ± 3.37 | 1.139 ± 0.034 | 24.71 ± 0.521 |
| TF11 | 0.414 ± 0.031 | 0.471 ± 0.027 | 12.101 ± 1.26 | 1.137 ± 0.015 | 22.48 ± 0.382 |
| TF12 | 0.411 ± 0.036 | 0.469 ± 0.032 | 12.366 ± 2.78 | 1.141 ± 0.023 | 22.71 ± 0.285 |
| TF13 | 0.436 ± 0.022 | 0.487 ± 0.019 | 10.472 ± 2.27 | 1.169 ± 0.031 | 24.26 ± 0.378 |
| TF14 | 0.418 ± 0.039 | 0.478 ± 0.052 | 12.552 ± 1.36 | 1.143 ± 0.024 | 25.31 ± 0.216 |
| TF15 | 0.410 ± 0.036 | 0.462 ± 0.049 | 11.412 ± 3.21 | 1.122 ± 0.012 | 26.43 ± 0.218 |
| TF16 | 0.411 ± 0.042 | 0.464 ± 0.041 | 11.422 ± 3.45 | 1.128 ± 0.018 | 26.72 ± 0.290 |
Table 11: Characterization of FRT powder blend batches (TF1-15). Results are average of three determinations (Mean ± SD)
Pre-compression characterization of FRT powder blends
Tablets were tested for pre-compression studies and the results revealed that all the batches possessed good flow properties. The bulk and TD of the batches (TF1-16) were within range of 0.402 gm/cc-0.436 gm/cc and 0.461 gm/cc- 0.487 gm/cc respectively. By using the values of bulk and tapped densities, CI and HR were calculated. If the powder blend is more compressible then the powder will be less flowable and vice versa. The value of CI and HR was found to be within range between 10.351%-12.987% and 1.116- 1.169 respectively. As the value of HR was less than 1.25, the shows good flow properties. The AOR below 30° range indicates well to excellent flow properties of powder. Lower the friction occurring within the mass, better the flow rate. The AOR was found to be in range 22.02°-26.72°.
Post-compression characterization of FRT
After compression of the powder blends, the tablets were tested for the post-compression characteristics such as appearance, thickness, hardness, drug content friability and disintegration time. The thickness varied from 2.18 mm- 2.50 mm and weight varied between 99.46 mg-101.16 mg. The thickness and weight of tablets were under passable limits. Hardness was in range between 2.78 kg/cm2-3.63 kg/cm2. Only batch TF16 was outside passable limit with a hardness value of 2.78 kg/cm2 ± 0.234 0 kg/cm2. Drug content were in range between 99.82%-102.31% which is under passable limits. The friability of the tablets varied between 0.30%-1.72%. A value of friability less than 1% shows transport stress withstanding properties and batches TF1-15 passed this test while batch TF16 showed a value of 1.72% ± 0.048% which was outside passable limit. From the evaluation of preliminary trial batches, it can be summed that concentration of each disintegrants had a negative effect on disintegration time. The disintegration time decreased from 122.24 s to 18.82 s as the concentration of Ac-Di-Sol was increased from 1%-6% w/w while the value of disintegration time decreased from 134.27 to 75.18 for sodium starch glycolate at same concentrations. The combination batches TF13-16 showed lesser values of disintegration time with TF16 showing disintegration time value of 14.18 s which was least of all the batches. It can be inferred from evaluation parameters of the batch TF16 that when both the super disintegrants were used at concentration level of 9% w/w the manufactured tablets showed a lack of mechanical strength. Therefore, the level of super disintegrants for formulating factorial design batches was set at 2% w/w, 4% w/w and 6% w/w for the individual super disintegrant (Tables 12 and 13).
| Batches | Thicknessα (mm) |
AverageWeightβ (mg) |
Hardnessα (kg/cm2) |
Friabilityα (%) |
DisintegrationTimeα(s) | Drugcontentγ (%w/w) |
|---|---|---|---|---|---|---|
| TF1 | 2.27 ± 0.18 | 100.36 ± 3.183 | 3.32 ± 0.125 | 0.60 ± 0.078 | 122.24 ± 2.46 | 100.43 ± 1.25 |
| TF2 | 2.49 ± 0.015 | 100.72 ± 3.074 | 3.49 ± 0.241 | 0.37 ± 0.169 | 113.52 ± 2.92 | 100.66 ± 1.735 |
| TF3 | 2.32 ± 0.215 | 101.58 ± 2.311 | 3.48 ± 0.237 | 0.35 ± 0.123 | 102.87 ± 1.27 | 99.82 ± 0.757 |
| TF4 | 2.19 ± 0.087 | 101.00 ± 3.321 | 3.40 ± 0.118 | 0.48 ± 0.22 | 96.28 ± 2.38 | 100.79 ± 0.822 |
| TF5 | 2.43 ± 0.131 | 99.55 ± 2.762 | 3.66 ± 0.095 | 0.61 ± 0.243 | 82.14 ± 3.55 | 101.02 ± 1.526 |
| TF6 | 2.18 ± 0.029 | 101.05 ± 2.623 | 3.54 ± 0.103 | 0.43 ± 0.165 | 62.82 ± 3.37 | 100 ± 1.321 |
| TF7 | 2.32 ± 0.122 | 100.4 ± 3.103 | 3.61 ± 0.195 | 0.51 ± 0.172 | 134.27 ± 3.45 | 100.22 ± 1.359 |
| TF8 | 2.38 ± 0.188 | 101.04 ± 2.954 | 3.48 ± 0.249 | 0.56 ± 0.246 | 121.19 ± 2.9 | 100.59 ± 1.293 |
| TF9 | 2.46 ± 0.131 | 99.97 ± 2.905 | 3.36 ± 0.086 | 0.67 ± 0.106 | 110.28 ± 3.32 | 100.01 ± 1.043 |
| TF10 | 2.32 ± 0.237 | 99.46 ± 2.575 | 3.34 ± 0.182 | 0.51 ± 0.155 | 98.19 ± 1.76 | 100.13 ± 1.158 |
| TF11 | 2.44 ± 0.15 | 101.16 ± 3.123 | 3.62 ± 0.162 | 0.50 ± 0.04 | 87.83 ± 3.11 | 100.59 ± 0.845 |
| TF12 | 2.50 ± 0.026 | 100.02 ± 3.235 | 3.50 ± 0.187 | 0.58 ± 0.238 | 75.18 ± 2.51 | 100.48 ± 1.217 |
| TF13 | 2.36 ± 0.18 | 100.21 ± 3.354 | 3.63 ± 0.144 | 0.63 ± 0.032 | 78.36 ± 4.33 | 99.45 ± 2.371 |
| TF14 | 2.30 ± 0.123 | 100.67 ± 2.828 | 3.13 ± 0.135 | 0.74 ± 0.071 | 35.22 ± 2.56 | 102.31 ± 4.17 |
| TF15 | 2.19 ± 0.11 | 99.97 ± 2.849 | 3.76 ± 0.216 | 0.41 ± 0.043 | 17.16 ± 3.21 | 100.33 ± 2.76 |
| TF16 | 2.28 ± 0.206 | 99.95 ± 3.157 | 2.78 ± 0.234 | 1.72 ± 0.048 | 14.18 ± 3.82 | 100.67 ± 2.39 |
Table 12: Post-compression Characterization of FRT batches (TF1-TF16) (All values represent mean ± standard deviation, α n=3, β n=20, γ n=10)
Response surface analysis
2-D contour plots and 3-D response surface plots provide information about effect of independent variables on dependent variables. From the 2-D contour plot it can be seen that as the level of X1 and X2 were increased from -1 to 1, the disintegration time decreased from 77 s to 18 s (Figure 14). Response surface plot also depicts similar antagonistic effect of X1 and X2 on disintegration time (Figure 15). 2-D contour plot and response surface plot depict the synergistic effect of independent variables X1 (Figures 16 and 17). Plot shows that as the levels of X1 were increased from -1 to 1, the friability increased from 0.248% to 0.771% while as the levels of X2 were increased friability decreased. A linear behavior was seen between independent and dependent variables.
The quadratic equations for both the responses are shown below.
(For disintegration time)

(For friability)

Effect of formulation variables on friability
Friability was found to vary between 0.25% to 0.78%. Friability should be less than 1.0% and all the batches passed this criterion. As the coefficient b1 has a positive sign this means that increase in concentration of Ac-di-sol lead to an increased friability. At higher levels of Ac-di-sol mechanically week tablets were produced. As the concentration of sodium starch glycolate was increased the disintegration time decreased 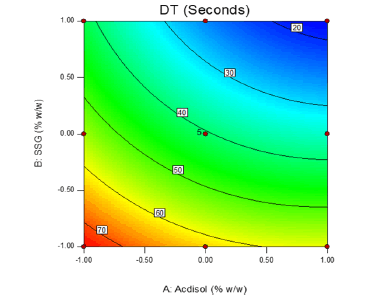
Figure 14: 2-D contour plot displaying influence of independent variables X1 and X2 on dependent variable Y1 (Disintegration time)
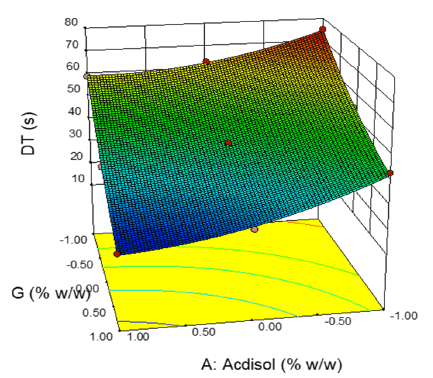
Figure 15: 3-D response surface plot displaying influence of independent variables X1and X2 on dependent variable Y1 (Disintegration time)
Effect of formulation variables on disintegration time
As the concentration of Ac-di-sol or sodium starch glycolate were increased the disintegration time decreased, Higher Ac-di-sol concentration lead to quick disintegration as the polymers swelled on absorbing water and caused disintegration of tablet due to the pressure generated. Higher concentration of sodium starch glycolate also decreased the disintegration time as this polymer absorbs moisture by wicking. Disintegration time is one of the most important criteria in developing FRT and the disintegration time varied between 18 s to 75 s.
ANOVA and Lack-of-fit test
ANOVA and Lack-of-fit test analysis were done for the model (Tables 13-15). The results of the ANOVA, were applied to identify insignificant factors. The Model F-value of 261.04 and 44.32 with a p-value of <0.0001 were significant which implies that the models were significant. Values of “Probability>F” less than 0.0500 indicate model terms are significant. In this case X1, X2 are significant model terms. Predicted Residual Sum of Squares (PRESS) is a measure to determine the fittingness of each design point in the model. Value of PRESS was found to be 55.91 and 0.043 for both responses which were small, smaller the PRESS statistic, better the model fits the data points. High R square value of 0.9947 and 0.9694 for both responses suggested that these models are significant. Lack of fit is an unwanted characteristic for a model. A significant value of lack of fit test shows that the model does not fit the data well. In our case, the p-value for the lack of fit of the 2 models was 0.6722 and 0.2936 and both the values were insignificant, so the model fits the data generated. The model showed a statistically insignificant lack of fit.
| Superdisintegrants | |
|---|---|
| Ac-Di-Sol (%w/w) | Sodium starch glycolate (%w/w) |
| 2 | 2 |
| 4 | 4 |
| 6 | 6 |
Table 13: Levels of superdisintegrants selected for experimental design batches for formulating FRT
| Source | Sum of Squares | df | Mean Square | F Value | p-value Prob > F | PRESS | R2 Value | |
|---|---|---|---|---|---|---|---|---|
| Model | 2851.02 | 5 | 570.2 | 261.04 | <0.0001 | - | - | |
| X1Acdisol | 600 | 1 | 600 | 274.69 | <0.0001 | 55.91 | 0.9947 | |
| X2-SSG | 2090.67 | 1 | 2090.67 | 957.13 | <0.0001 | - | - | |
| X1 X2 | 20.25 | 1 | 20.25 | 9.27 | 0.0187 | - | - | |
| X1 | 54.65 | 1 | 54.65 | 25.02 | 0.0016 | - | - | |
| X2 | 32.84 | 1 | 32.84 | 15.03 | 0.0061 | - | - | |
| Residual | 15.29 | 7 | 2.18 | - | - | - | - | |
| Lack of Fit | 4.49 | 3 | 1.5 | 0.55 | 0.6722 | - | - | |
| Pure Error | 10.8 | 4 | 2.7 | - | - | - | - | |
| Cor. Total | 2866.31 | 12 | - | - | - | - | - | |
Table 14: Analysis of variance and lack-of-fit tests for the response surface model Y1 (Disintegration time)
| Source | Sum of Squares | df | Mean Square | F Value | p-value Prob > F | PRESS | R2 Value |
|---|---|---|---|---|---|---|---|
| Model | 0.23 | 5 | 0.045 | 44.32 | <0.0001 | - | - |
| X1-Acdisol | 0.029 | 1 | 0.029 | 28.62 | 0.0011 | 0.04 | 0.9694 |
| X2-SSG | 0.17 | 1 | 0.17 | 171.78 | <0.0001 | - | - |
| X1 X2 | 1.60E-03 | 1 | 1.60E-03 | 1.57 | 0.2501 | - | - |
| X2 | 1.52E-03 | 1 | 1.52E-03 | 1.5 | 0.2607 | - | - |
| X2 | 0.02 | 1 | 0.02 | 19.39 | 0.0031 | - | - |
| Residual | 7.12E-03 | 7 | 1.02E-03 | - | - | - | - |
| Lack of fit | 4.05E-03 | 3 | 1.350E-03 | 1.76 | 0.2936 | - | - |
| Pure error | 0.23 | 5 | 0.045 | 44.32 | <0.0001 | - | - |
| Cor. Total | 0.029 | 1 | 0.029 | 28.62 | 0.0011 | - | - |
Table 15: Analysis of variance and lack-of-fit tests for the response surface model Y2 (Friability)
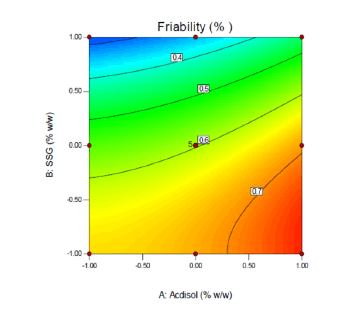
Figure 16: 2-D contour plot displaying effect of independent variables X1 and X2
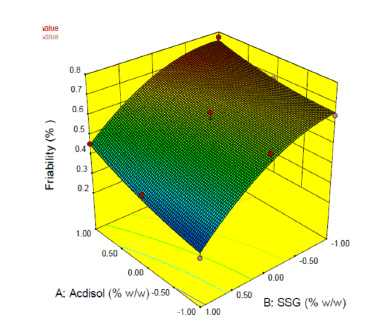
Figure 17: 3-D Response surface plot displaying influence of independent variables X1 and X2 on dependent variable Y2 (Friability)
Optimization and characterization of FRT
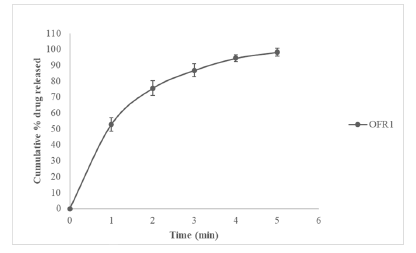
The suggested optimized formulation was 0.509 and 0.358 for X1, and X2 respectively, with the corresponding desirability (D) value of 1.00. This factor level combination predicted the response as Y1=30 s and Y2=0.570% (Table 16). To confirm the model adequacy for the prediction, 3 batches of the optimized formulations (OFR1) were prepared and all the evaluation parameters were performed (Tables 17 and 18). In vitro release studies were also performed for optimized batch of FRT shown in Figure 18.
Figure 18: In vitro release profile of Terbutaline sulphate from optimized batch of fast release formulations (OFR1)
| Solution | ||||
|---|---|---|---|---|
| Ac-di-sol (X1) | SSG (X2) | DT (s) | Friabilityα (%) | Desirability |
| 0.509 | 0.358 | 30 | 0.57 | 1 |
Table 16: Model predicted levels of dependent and independent variables
| Hardnessα (Kg/cm2) | Friabilityα (%) | Disintegration timeα (s) | Drug Content (%w/w) | Average Weightβ (mg) |
|---|---|---|---|---|
| 3.19 ± 0.06 | 0.58 ± 0.021 | 31.67 ± 0.577 | 100.56 ± 1.79 | 101.35 ± 1.95 |
Table 17: Evaluation results of optimized batch of FRT (OFR1)
| Time (min) | Cumulative % release |
|---|---|
| 1 | 52.49 ± 4.252 |
| 2 | 75.95 ± 4.565 |
| 3 | 88.02 ± 2.485 |
| 4 | 94.36 ± 1.923 |
| 5 | 98.93 ± 0.849 |
Table 18: In Vitro release profile data of cumulative % Terbutaline sulphate released from optimized batch of FRT
Conclusion
Present research was aimed at developing chrono modulated drug delivery formulation for the treatment of nocturnal asthma. To determine the authenticity of the drug sample (Terbutaline sulphate), various physical, physicochemical and spectrophotometric methods were employed. UV and FTIR spectroscopy were used to verify the authenticity of the sample and the sample was found to be authentic. Drug polymer compatibility studies were conducted and no sign of physical compatibility was seen. The FTIR studies of physical mixture of the drug with different polymers showed no sign of interaction as the spectra of mixtures showed the peaks similar to pure drug spectra. UV spectroscopic method was selected as preferred analytical method for determination of Terbutaline sulphate. Trial batches (preliminary) were formulated to study influence of polymer concentration on the physical properties and release profiles of the formulations. The final concentration of the polymers to be used in experimental design was fixed using the preliminary trial batches data.
Acknowledgement
None.
Conflict of Interest
Authors have no conflict of interest to declare.
References
- B.G. Katzung, S.B. Masters, A.J. Trevor, Basic & clinical pharmacology bertram, J McGraw-Hill Education, 1(2003).
- M.H. Smolensky, Chronobiology and chronotherapeutics applications to cardiovascular medicine, Am J Hematol, 9(1996):11-21.
- A. Reinberg, M.H. Smolensky, Biologic rhythms and medicine, cellular, metabolic, pathophysiologic, and pharmacologic aspects, Springer Verlag GmbH, 305(1983).
- E. Haus, Y. Touitou, Biologic rhythms in clinical and laboratory medicine, Springer-Verlag, Heidelberg, 730(1992).
- M.H. Smolensky, N.A. Peppas, Chronobiology, drug delivery, and chronotherapeutics, Adv Drug Del Revs, 59(2007):828–851.
- H. Dardente, N. Cermakian, Review: Molecular circadian rhythms in central and peripheral clocks in mammals, J Chronobiol Int, 24(2007):195–214.
- D. Duguay, N. Cermakian, The crosstalk between physiology and circadian clock proteins, Chronobiol Int, 26(2009):1479–1513.
[Crossref] [Google Scholar] [PubMed]
- J.P. Hanifin, G.C. Brainard, Photoreception for circadian, neuroendocrine, and neurobehavioral regulation, J Physiol Anthropol, 26(2007):87–94.
- E. Maronde, J.H. Stehle, The mammalian pineal gland: Known facts, unknown facets, Trends Endocrinol Metab, 18(2007):142–149.
- D.A. Golombek, D.E. Rosenstein, Physiology of circadian entrainment, Physiol Rev, 90(2010):1063–1102.
- D. Duguay, N. Cermakian, The crosstalk between physiology and circadian clock proteins, Chronobiol Int, 26(2009):1479–1513.
- T. Bussemer, N.A. Peppas, R. Bodmeier, Evaluation of the swelling, hydration and rupturing properties of the swelling layer of a rupturable pulsatile drug delivery system, Eur J Pharm Biopharm, 56(2003):261–270.
Copyright: © 2023 Mohan Vikas, et al. This is an open access article distributed under the terms of the Creative Commons Attribution License, which permits unrestricted use, distribution, and reproduction in any medium, provided the original work is properly cited.

