

Review Article: Journal of Drug and Alcohol Research (2023) Volume 12, Issue 10
A Succinct Assessment of the Development, Validation, and Method Verification of Analytical Methods for Natural and Synthetic Therapeutic Molecules
Sandip Kumar Dey1, Sumanta Mondal1*, K.N. Killari2, Samson Israel3, G.V. Sampath Kumar2 and Abu Mohiuddin12Department of Pharmacology, AU College of Pharmaceutical Sciences, Andhra University, Visakhapatnam 530003, Andhra Pradesh, India
3Department of Analysis, St Ann’s college of pharmacy Nayunpallli,Chirala, 523187, Andhra Pradesh, India
Sumanta Mondal, Department of Pharmaceutical Chemistry, GITAM School of Pharmacy, GITAM (Deemed to be University), Visakhapatnam 530016, Andhra Pradesh, India, Email: mondalresearch@gmail.com
Received: 01-Nov-2023, Manuscript No. JDAR-23-110670; Editor assigned: 03-Nov-2023, Pre QC No. JDAR-23-110670 (PQ); Reviewed: 17-Nov-2023, QC No. JDAR-23-110670; Revised: 22-Nov-2023, Manuscript No. JDAR-23-110670 (R); Published: 29-Nov-2023, DOI: 10.4303/JDAR/236266
Abstract
Analytical method development, validation, and verification are the continuous and interdependent tasks associated with the research and development, quality control, and quality assurance departments. The primary purpose of the analytical method development and validation is to prove that the proposed analytical method is accurate, specific, precise, and robust in the pharmaceutical industry for analysis of a drug moiety as the drug must be manufactured to the highest quality levels. Analytical methodology development has become an essential activity of study. Recent development in analytical methods has resulted from the advancement of analytical instruments. Analytical techniques such as identification, assay, related substances, residual solvents, metal impurities etc., are developed and validated for drug substances or drug products and their intermediates, raw materials, and excipients. Method validation is outlined as the method of proving that an analytical technique is appropriate for the meant use, and this is often an essential requirement for analytical purposes. Methodology validation results are used to decide the quality, reliability, and consistency of analytical data. Validation parameters are explained in terms of accuracy, precision, linearity, specificity, Limit of Detection (LOD), Limit of Quantification (LOQ), and robustness. This detailed review offers concepts concerning varied strategies to check the stability of the drug and varied validation parameters as per various regulative authorities. The review focused on the concept, criteria, steps, strategy, and importance of analytical method development validation and verification.Analytical method development, validation, and verification are the continuous and interdependent tasks associated with the research and development, quality control, and quality assurance departments. The primary purpose of the analytical method development and validation is to prove that the proposed analytical method is accurate, specific, precise, and robust in the pharmaceutical industry for analysis of a drug moiety as the drug must be manufactured to the highest quality levels. Analytical methodology development has become an essential activity of study. Recent development in analytical methods has resulted from the advancement of analytical instruments. Analytical techniques such as identification, assay, related substances, residual solvents, metal impurities etc., are developed and validated for drug substances or drug products and their intermediates, raw materials, and excipients. Method validation is outlined as the method of proving that an analytical technique is appropriate for the meant use, and this is often an essential requirement for analytical purposes. Methodology validation results are used to decide the quality, reliability, and consistency of analytical data. Validation parameters are explained in terms of accuracy, precision, linearity, specificity, Limit of Detection (LOD), Limit of Quantification (LOQ), and robustness. This detailed review offers concepts concerning varied strategies to check the stability of the drug and varied validation parameters as per various regulative authorities. The review focused on the concept, criteria, steps, strategy, and importance of analytical method development validation and verification.
Keywords
Analytical method development; Analytical method validation; Stability; High-performance liquid chromatography; Drug substances; Drug products
Introduction
To ensure compliance with quality and safety standards, the United States, Europe, Japan, and other countries have published compendia, or pharmacopoeias, that describe official test methods for many marketed drug products, including respective drug substances. For example, the compendia analytical methods found in United States Pharmacopeia 41 (USP 41, NF 36, 2018) are legally recognized analytical procedures under section 501 (b) of the Federal Food, Drug, and Cosmetic Act [1]. For these compendia methods, USP provides regulatory guidance for method validation. In addition, the validation of analytical methods is covered by the United States Code of Federal Regulations (CFR). Specific references are 21 CFR 211.165 (e) and 21 CFR 211.194 (a) [2].
Analytical Method Development
Drug analysis is the basis for the determination of the product. Very often, there is a time lag from the date of introduction of a drug into the market to its inclusion in pharmacopoeias. This happens because of the possible uncertainties in the continuous and broader usage of these drugs, report of new toxicities and development of patient resistance and the introduction of better drugs by the competitors [3].
Under these conditions, standard and analytical procedures for these drugs may not be available in pharmacopoeias. Therefore, it becomes necessary to develop new analytical methods for such drugs. In brief, the reasons for the development of newer methods of drug analysis are [4].
The drug substances or drug products may not be official in any pharmacopoeias. A proper analytical procedure for the drug may not be available in the literature due to patent regulations. Analytical methods may not be available for the drug as formulation excipients. Analytical methods for a drug in combination with other drugs may not be available. The existing analytical procedures may require expensive reagents and solvents. It may also involve cumbersome extraction and separation procedures, which must be revised [5].
The methods of estimation of drugs are separated into physical, chemical, physicochemical and biological categories. Of these methods, physical and physicochemical methods are generally used, and most of the physical methods of analysis engross the studying of the different physical properties of a substance. They determine the solubility, transparency or degree of turbidity, colour, density or specific gravity (for liquids), melting, freezing, boiling points and moisture content. Physicochemical methods are utilized to examine the physical phenomena due to chemical reactions. In the Physicochemical methods, Optical (Refractometry, Polarimetry, Emission Spectrophotometry and Nephelometry or Turbidometry), Electrochemical (Potentiometry, Amperometry and Polarography), and Chromatography (Paper, Column, Thin Layer, Gas Liquid Chromatography, High-Performance Liquid Chromatography methods are usually preferable [6,7]. Nuclear Magnetic Resonance (NMR) spectroscopy is extremely useful for identification and analysis of organic compounds. The principle on which this form of spectroscopy is based is simple, the nuclei of many kinds of atoms act like tiny magnets and tend to become aligned in a magnetic field. As a result, nuclear magnetic resonance spectrometry can be used to deduce the number and types of different nuclei of the groups attached to the atom containing the nucleus studied. It is useful for qualitative and quantitative analysis of organic compounds. GC-MS combination is one of the most prominent, powerful tools available. The chemical methods include the volumetric and gravimetric procedures, which are mainly depend on complex formation, acid-base and redox reactions. Titrations in complexometric and non-aqueous media have been extensively utilized in pharmaceutical analysis whenever the sensitivity at the mg level is sufficient and the interferences are negligible. Modern methods such as HPLC, UPLC, GLC, GC-MS/MS, LC-NMR and Liquid chromatography– mass spectrometry are the available choices for quantification of active involving sophisticated equipment, which is highly sensitive, accurate and consume a very tiny amount of samples for analysis [8,9].
Steps Involved in Method Development
Analyte standard characterization
a) All known information about the analyte and its structure is collected, i.e., physical and chemical properties.
b) The standard analyte (100% purity) is obtained. The necessary arrangement is made for the proper storage (refrigerator, desiccators and freezer).
c) When multiple components are to be analyzed in the sample matrix, the number of components is noted, data is assembled, and the availability of standards for each one is determined [9,10].
Method requirements
The goals or requirements of the analytical method that need to be developed are considered, and the analytical figures of merit are defined. The required detection limits, selectivity, linearity, range, accuracy and precision are defined [9,6].
Literature search and prior methodology
The literature for all types of information related to the analyte is surveyed. Physical and chemical properties, solubility and relevant analytical methods, books, periodicals, chemical manufacturers and regulatory agency compendia such as USP/NF are reviewed for synthesis. Chemical Abstracts Service (CAS) automated computerized literature searches are convenient [9].
Choosing a method
Only those methods [spectroscopic (UV, IR, MS etc.), chromatographic (GC, HPLC, GPC, IEC, etc.)] that are compatible with sample stability are considered. Using the information in the literature and prints, the methodology is adapted. The methods are modified wherever necessary. Sometimes it is necessary to acquire additional instrumentation to reproduce, modify, improve or validate existing methods for in-house analytes and samples. If there are no prior methods for the analyte in the literature, from analogy, the compounds that are similar in structure and chemical properties are investigated and worked out. There is usually one compound for each analytical method that already exists that is similar to the analyte of interest [9].
Instrumental setup and initial studies
The required instrumentation is to be set up. Installation, operational and performance qualification of instrumentation using laboratory Standard Operating Procedures (SOPs) are verified. New consumables (e.g., solvents, filters and gases) are always used. For example, method development has yet to be started on an HPLC column that has been used earlier. The analyte standard in a suitable injection or introduction solution and known concentrations and solvents are prepared. Starting with an authentic, known standard rather than a complex sample matrix is essential. If the sample is highly close to the standard (e.g., bulk drug), then it is possible to start work with the actual sample [9,11].
Optimization
During optimization, one parameter is changed at a time, and a set of conditions is isolated rather than using a trial and error approach. Work has been done from an organized, systematic plan, and every step is documented (in a lab notebook) in case of dead ends [9].
Documentation of analytical figures of merit
The originally determined analytical figures of merit are the Limit of Quantitation (LOQ), the Limit of Detection (LOD), linearity, time per analysis, cost, sample preparation etc., documented [9].
Evaluation of method development with actual samples
Sample preparation aims to create a processed sample that yields better analytical results than the initial sample. The prepared sample should be an aliquot relatively free of interferences that is compatible with the HPLC method and will not damage the column. The main sample preparation techniques are Liquid-Liquid Extraction (LLE) and Solid-Phase Extraction (SPE). These methods separated the analyte of interest from the sample matrix so that as few potentially interfering species as possible were carried through to the analytical separation stage [9,12].
Determination of percent recovery of actual sample and demonstration of quantitative sample analysis
Percent recovery of spiked, authentic standard analyte into a sample matrix that is shown to contain no analyte is determined. Reproducibility of recovery (average+/-standard deviation) from sample to sample and whether recovery has been optimized or not has been shown. It is extrinsic to obtain 100% recovery as long as the results are reproducible and known with a high degree of certainty. The validity of the analytical method can be verified only by laboratory studies. Therefore, documentation of the successful completion of such studies is essential for determining whether a method is suitable for its intended applications [9].
Approaches of Stability Indicating Method Development
A Stability-indicating assay method can be defined as a “validated quantitative analytical method that can detect the change with time in the chemical, physical or microbiological properties of the drug substance and drug products are specific so that the content of active ingredients and degradation products can be accurately measured without interference.
Generally forced degradation/stress testing generates the samples for stability-indicating assay methods. Forced degradation/stress testing is “the stability testing of drug substance and drug product under conditions exceeding those used for accelerated stability testing”. Degradation can be achieved by exposing the drug, for an extended period, to extremes of pH (HCl or NaOH solutions of different strengths), at elevated temperature, to hydrogen peroxide at room temperature, to UV light, and to dry heat (in an oven) to achieve degradation to an extent of 5%-20%. Generally, trial and error experimentation is used during these experiments. This trial and error approach is generally cost, labour, and time intensive and should be substituted with some systematic approach. From exhaustive literature, it was observed that experimental design in forced degradation experiments could be used to save cost and labour by avoiding trial and error experimentation.
General Steps Involved in Method Development and Validation
The General steps involved in method development and validation include
Step 1
Research compound characteristics (pKa, solubility, log P, Synthetic scheme, formulation, manufacturing process, etc.) [13]. Review of analytical methods if available. Obtain samples and structures of drug substances, available degradation or synthetic by-products, and placebo (excipient ratio) [14].
Step 2
Based on the molecule’s nature (acidic/basic/neutral/zwitterionic) and required sensitivity, determine the active working concentration (mg/mL) in the desired solvent/solvent mixture, level sample volume and detection sensitive wavelength selection using a linear method and selection of specific columns for chromatographic techniques [13,15].
Step 3
Define optimal and repeatable stress conditions (yield 2%- 10% degradation) if specified impurities are unavailable [13]. The gradient chromatography method can be further fine tuned/optimized based on the elution pattern to achieve desired selectivity, peak shape concerning tailing factor, resolution, capacity factor etc. and an acceptable spectral peak purity for spectroscopic techniques optimum level of detection of lambda max and interferences [14-17].
Step 4
Verify the developed method based on the quantification technique adopted with minimum validation parameters, including robustness, before initiating the validation in the cGMP environment to ensure method workability [13,15].
Step 5
A detailed report shall be prepared with positive and negative outcomes experienced during development [13,15] (Figure 1).
Analytical Method Validation
Method validation proves (through scientific studies) that an analytical method is acceptable for its intended purpose [18]. The validation of an analytical method is the process by which laboratory studies establish that the performance characteristics of the method meet the requirement for the intended application [19]. This implies that the validity of a method can be demonstrated only through laboratory studies. The essential requirement to ensure the quality and reliability of analytical results are well-documented experimental studies; validation should address the performance of the analytical procedure under conditions of routine use; suitability of the procedure for its intended purpose is strongly connected with both the requirements (i.e., specifications) and the design of the individual analytical procedure.

Figure 1: General steps involved in method development and validation
Methods should be validated or revalidated before their introduction and routine use whenever the conditions change for which the method has been validated, e.g., an instrument with different characteristics and wherever the method is changed and the change is outside the method’s original scope, etc. [20].
The most common types of analytical procedures to be validated are identification tests, quantitative measurement of the content of impurities, semi-quantitative and limit tests for the control of impurities, quantitative tests for the assay of significant components in samples of drug substances or drug products (assay, CU, dissolution rate, etc.), quantitative measurements of physical parameters (fill volume, particle size, melting point, hardness, etc.).
Typical Validation Parameters
Different test methods require different validation parameters. Parameters mentioned on the table are not limited to, and can be altered in case to case basis [21] (Table 1).
Table 1: Typical validation parameters required test or characteristics
| Type of test/Characteristics | Identification | Impurity testing | Assay/Dissolution Content/Potency | |
|---|---|---|---|---|
| Quantitative | Limit | |||
| Accuracy | - | + | - | + |
| Precision-Repeatability | - | + | - | + |
| Precision-Intermediate Precision | - | + | - | + |
| Specificity | + | + | + | + |
| LOD | - | - | + | - |
| LOQ | - | + | - | - |
| Linearity | - | + | - | + |
| Range | - | + | - | + |
| Robustness | - | + | - | + |
| *Note: (-) Signifies that this characteristic is not normally evaluated, (+) Signifies that this characteristic is normally evaluated. | ||||
For certain physical tests, it may be necessary to validate additional parameters similar to the requirements for assay. The lack of specificity of one analytical procedure may be compensated by other supporting analytical procedures. Reproducibility may be considered in the case of analytical method transfer by co-validation approach; in cases where reproducibility has been performed, intermediate precision is not required.
Discussion on Validation Parameters
System suitability
A parameter of analytical method validation can define system suitability. However, it has a severe presence in the validation study as the system suitability test ensures the acceptability of the instrument, which means the instrument used to generate the evidence was working correctly at the time of analysis [22,23]. The system suitability test(s) defined in the method generally include some or all of the parameters defined in current USP <621> chromatography or refer as described in other pharmacopoeias: System precision, tailing factor, column efficiency, resolution, and signal to noise ratio. System suitability is performed whenever the method is run [24].
System suitability testing is integral to analytical procedures (wherever applicable). The tests are based on the concept that the equipment and instrument, electronic data systems, analytical operations and sample(s) to be analyzed constitute an integral system that can be evaluated. Perform the system suitability test as described in the method.
Document at least one set of system suitability results in the validation report [22,23]. System precision is a measure of the overall ability of the analytical instrument to reproduce a measurement. Determine the response for replicate injections or readings of the standard solution as directed in the method. The system suitability test generally defines the number of replicates. When no guidance is provided in the method, data from replicate injections are used to report the % RSD; refer to current USP<621> for relative standard deviation requirements or refer to as described in other pharmacopeias [24].
Evaluate the system suitability requirements as directed in the method. Analytical procedures should proceed if the system suitability requirements meet the predefined acceptance criteria.
Specificity
The specificity of a method is a measure of its ability to quantify analyte (s) in the presence of potential interference from diluent components, excipients, impurities or degradants. A lack of specificity in an individual analytical procedure may be compensated by other supporting analytical procedures [25].
Specificity can be determined in different ways, like procedure for identification methods, procedure for assay and impurity test methods, specified impurities available method, specified impurities not available, and the stability-indicating test method.
Procedure for identification methods: Suitable identification tests should be able to discriminate between compounds of closely related structures which are likely to present. The discrimination of a procedure may be confirmed by obtaining positive results from samples containing the analyte (e.g., by comparison with a known reference material) coupled with negative results from samples which do not contain the analyte. In addition, the identification test may be applied to material structurally similar to or closely related to the analyte to confirm that a positive response is not obtained.
IR: Demonstrate the presence of the IR bands of the drug substance (including salt form) and the absence of relevant bands in the IR of similar compounds.
TLC: comparison of Rf values and colours.
Liquid Chromatography (HPLC): Retention time, relative retention time, UV Spectrum.
UV-Visible spectrophotometer: Identity through λmax/ spectra.
Procedure for assay and impurity test methods: Representative chromatograms should be used to demonstrate specificity, and individual components should be appropriately labelled. Similar consideration should be given to other separation techniques.
Specificity may be demonstrated by the resolution of the 2 components closest to each other. For drug products, it may be appropriate to perform stress studies for the placebo components to demonstrate that the degradation of excipients does not interfere with the quantitation of the active substance or its related substances.
Specified impurities available: If reference materials for impurities and degradation products are available, specificity for the method should be demonstrated employing a recovery of the experiment; ICH Q2 R1 suggests spiking the pure substance (drug substance or drug product) with appropriate levels of impurities or excipients and to demonstrate that the result is unaffected by the presence of these materials (by comparison with the result obtained on unspiked samples) and demonstrating the separation of these impurities individually and from other components in the sample matrix [26].
Specified impurities not available and for stability-indicating test method: If no specified impurity or degradation product standards are available (i.e., in a situation where standards are available for some impurities but not for all, stress testing may also be justifiable), specificity is demonstrated by analyzing peak purity of chromatograms from stressed samples and test solutions stored under relevant conditions (i.e., light, heat, humidity, acid/base hydrolysis and oxidation).
Forced Degradation
Studies are conducted to evaluate any possible interference due to unknown potential degradants of the active ingredient or excipients [27,28].
General guidelines recommended below are for each forced degradation condition. These may be varied as required to achieve a target of approximately 5%-20% degradation (loss of signal for the active) in any of the stress conditions (if achievable). If a tested condition produces no degradation, a stronger reagent concentration, a longer exposure time, or the addition of heat must be tested. A milder condition must be tested if a tested condition produces extensive active degradation. Samples should be exposed to light, providing an overall illumination of not less than 1.2 million lux hours and an integrated near ultraviolet energy of not less than 200-watt hours/m2 to allow direct comparisons between the drug substance and drug product wherever applicable. Peak purity shall be evaluated for the degraded samples [27,28] (Table 2).
Table 2: Recommendation for stress conditions in degradation study
| S.No. | Stress conditions | Recommendation for stress conditions |
|---|---|---|
| 1. | Acid degradation | Strength, volume, temperature and time should depend on the nature of the molecule and the type of diluent used. |
| 2. | Base degradation | |
| 3. | Oxidation degradation | 3% v/v hydrogen peroxide solution. |
| 4. | Heat degradation (dry) | Should depend on the nature of the molecule. |
| 5. | Humidity degradation | Exposed in about 75% RH for a suitable time period. |
| 6. | Photolytic degradation | Should be exposed to light providing an overall illumination of not less than 1.2 million lux hours and an integrated near ultraviolet energy of not less than 200 watt hours/m2. |
Where applicable, sample chromatograms, diagrams, or spectra should be given to visualize specificity. Peak purity may be demonstrated by multiple wavelength detection, or MS. Mass balance verification is strongly recommended for following reasons to conclude that method can detect all degradants, to conclude that method is a Stability Indicating Method (SIM), the process of adding together the assay value and levels of degradation products to see how closely these add up to 100% of the initial value, mass balance correlates the measured loss of a parent drug to the measured increase in the number of degradation products, estimate the assay of the final force degradation samples and assess the mass balance. The mass balance is to be at least 95% level; if the mass balance is less than the required criteria investigation to be done and justified. % of mass balance can be calculated by:
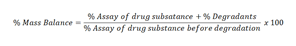
Example: Assay before degradation=98%, % total impurities before degradation: 1.5%, assay after degradation= 95%, % total impurities after degradation: 3.5%, % degradants=3.5%-1.5%=2.0%, mass balance=(95+2)/98 x 100=98.98%.
Limit of Detection (LOD) and Limit of Quantitation (LOQ)
The LOD of an individual analytical procedure is the smallest amount of analyte in a sample which can be detected but not necessarily quantified as an exact value. The LOQ is determined for all quantitative impurity and degradation product tests. The LOQ is the lowest analytical concentration, which yields a signal that can be quantified reliably [29,30].
Several approaches are possible for determining the LOD and LOQ like, based on the visual approach, signal to noise, and the standard deviation of the response and the slope.
Based on visual evaluation: A visual evaluation may be used wherever appropriate for non-instrumental procedures. For some instrumental procedures, this may also be used.
Based on the signal-to-noise ratio (S/N): Progressive dilutions of the analyte are prepared and analyzed. From this series, a peak is selected, of the same order of magnitude as the anticipated LOQ (LOD) (Figure 2).

Figure 2: Signal to noise ratio
H (S: Signal)=height of the peak measured from the peak apex to a baseline extrapolated over a distance ≥ 5 times the peak width at its half-height.
h (N: Noise)=difference between the most significant and smallest noise values (positive or negative) observed over a distance ≥ 5 times the width at the half-height of the peak and if possible, situated equally around the peak of interest.
The signal to noise ratio (S/N) is calculated as follows: A signal to noise ratio between 3 or 2:1 is generally considered acceptable for estimating the LOD. Similarly, A typical signal to noise ratio of 10:1 is acceptable for estimating the LOQ
Based on the standard deviation of the response and the slope: Calculation of LOD and LOQ based on the residual standard deviation or the standard deviation of the chromatographic response intercept and the regression line slope [31].
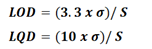
Here σ is the standard deviation of the response and S is the slope of the calibration curve. S is estimated from the slope of the calibration curve for the analyte.
The estimate of s may be carried out in a variety of ways, for example: Based on the standard deviation of the blank, based on a calibration curve (determined in the range of LOQ): The residual standard deviation of the regression line, or the standard deviation of the y-intercept may be used as the standard deviation.
The evaluation was done by; in the case of impurities/degradants of active, it is desirable to obtain a Limit of Quantitation (LOQ) value at or below the Reporting Limit (RL) but at most 50% of the specification limit. LOD shall be at least 30% of LOQ value.
Linearity
The linearity of an analytical procedure is its ability to obtain test results within a given range that is directly proportional to the concentration of the analyte in the sample. Therefore, the linearity test aims to demonstrate that the whole analytical procedure exhibits a linear response or direct proportionality throughout the relevant concentration range of the analyte. The linearity must be demonstrated over the whole range of concentrations to justify the single- point calibration. The linearity has to be assessed using equally distanced calibration solution (i.e. for example, 0.05%, 1.0%, 10%, 50%, 80%, 100%, 120%, and 150%); it is not allowed to bias the linear regression line by adding few data points at the end of calibrated range (i.e. for example 0.05%, 0.10%, 0.25%, 0.50%, 0.75%, 1.0% and 150%) [32,33].
The solutions of different concentrations may be prepared by diluting a standard stock solution of drug substance or impurities or by separately weighing synthetic mixtures of drug product components. For different weighing techniques, linearity testing might be combined with accuracy testing. Subsequent dilution should be avoided to minimize the risk of dilution error. To overcome this, all solutions should be prepared individually from the stock solution [32,33].
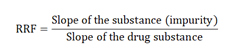
Linearity should be assessed by visual inspection of the obtained graphical plot and by critical judgment of the statistical parameters obtained from the linear regression analysis. For establishing the linearity, a minimum of 5 concentrations is recommended. Other approaches should be justified (as per ICH Q2 R1) [26]. The concentrations should be distributed over the relevant range. Linearity data, such as correlation coefficient (r), y-intercept, slope of the regression line, and residual sum of squares, should be submitted (as per ICH). Additional information, such as coefficient of determination (r2) and residual standard deviation, can also be reported from measuring different concentrations. Determination of Correction Factor (CF) or Relative Response Factor (RRF) from linearity.
The relative response factor is the ratio of the detector signal of a given impurity substance divided by the detector signal of the same amount of drug substance, in the case of salts, expressed as a free base or acid. Determine the RRF by using the following equation:
Accuracy (%Recovery)
The accuracy of a method is a measure of the closeness of test results to the actual value.
Accuracy is expressed as the percent recovery [34,35].
The accuracy test is intended to demonstrate the closeness of agreement between the value found and the value accepted as an actual conventional value or an accepted reference value. For drug substances and drug products, a minimum of 9 determinations over a minimum of 3 concentration levels covering the specified range (e.g., 3 concentration levels/3 replicates each, i.e. the complete analytical procedure including sample preparation should be carried out 9 times) [34,35].
Determine the amount of analyte present in each preparation and calculate the recovery using the following equation:
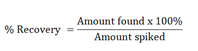
The evaluation depends on the chosen procedure, the addition of known amounts of drug substance or impurities to mixtures of drug product components or samples of the drug product: Recovery should be reported as per cent recovery (comparison of values found with known added amount), together with the relative standard deviation.
Comparison of the analytical procedure with a second, well-characterized procedure (reference method): Recovery should be reported as the difference between the mean of the values found and the value found using the reference method and the relative standard deviation. This is of particular interest in the case of titration. In this case, mass balance considerations should be discussed in the validation report (e.g., compares results from titration of several batches with HPLC results and considers those impurities included in the titration).
Accuracy should be reported as per cent recovery by the assay of a known added amount of analyte in the sample or as the difference between the mean and the accepted actual value together with % RSD.
Precision
Precision estimates total method variability and is considered on 3 levels repeatability, intermediate precision, and reproducibility.
Precision should be investigated using homogenous, authentic samples or an analyte of known purity/potency (e.g., reference material). The precision of an analytical procedure has to cover its intended range and is usually expressed as the variance, standard deviation or coefficient of variation of a series of measurements [36-38].
Repeatability or method precision
The repeatability or method precision measures the analytical method’s overall ability to reproduce a measurement, including the effects of the system and sample preparation. Repeatability should be assessed using several determinations within the specified range for the procedure. A minimum of nine determinations covering the specified range of the analytical procedure (e.g., 3 concentrations/3 replicates of each covering the appropriate range) or a minimum of 6 replicates at 100% of the test concentration is required for this experiment.
Intermediate precision
Intermediate precision includes the influence of additional random effects according to the intended use of the procedure in the same laboratory and can be regarded as an initial estimate for the long-term variability of the analytical procedure. The approach of the intermediate precision testing is to perform further repeatability studies with 6 determinations, varying the operator or equipment. As per ICH Q2 (R1), Intermediate precision should be established depending on the circumstances under which the procedure is intended to be used. The applicant should establish the effects of random events on the precision of the analytical procedure. Typical variations to be studied include days, analysts, instruments, etc. It is not considered necessary to study these effects individually. The use of an experimental matrix design approach is encouraged [25,37].
Reproducibility
While reproducibility is not generally required as part of regulatory submission (as per ICH Q2), though with the increasing registration of alternative analytical laboratories, it could be requested and is also of significant value in evaluating method performance when methods are transferred between sites [26]. Suppose co-validation is performed (receiving site included in the method validation). In that case, the data generated should be used to assess the reproducibility of the test method when applied in different laboratories and to evaluate the overall performance characteristics of the method [39,40]. The standard deviation generally does the evaluation, and the relative standard deviation (coefficient of variation) should be reported for each type of precision study.
Range
The range of an analytical procedure is the interval between the upper concentration (amounts) of analyte in the sample, for which it has been demonstrated that the analytical procedure has a suitable level of precision, accuracy and linearity (Table 3).
Table 3: Type of test procedure /analytical method and itâ??s range specification
| Type of test procedure/analytical method | Range to be covered |
|---|---|
| Assay (content) | At least 80%-120% of declaration (ICH Q2 R1) |
| Assay (content uniformity) | At least 70%-130% of declaration (ICH Q2 R1) |
| Assay (content uniformity of deliverable dose) | At least 60%-140% of declaration (ICH Q2 R1) |
| Assay (dissolution rate) | ± 20% over the specified range (ICH Q2 R1) |
| Testing for impurities | Reporting level-120% of specification (ICH Q2 R1) |
| Titration | At least 50%-150% of specification (ICH Q2 R1) |
The range of the analytical method should be determined from precision, Linearity and Accuracy study. Range should be inferred from precision, linearity and accuracy. The ‘higher of lower to lower of higher’ concept for different concentrations from precision, linearity and accuracy data is recommended to report the range of an analytical procedure (Figure 3).
Robustness
The robustness of an analytical procedure should establish the reliability of an analysis concerning small but deliberate changes or variations in method parameters. Based on the results of robustness (and on previously acquired experience), precautionary statements (e.g., use of a column oven, use of a particular brand of the column, strict pH control, etc.), or particular System Suitability Test (SST) requirements may have to be added to the analytical method [41]. The robustness testing should be done at least for assay, purity, content uniformity, related substance and dissolution method. It should not only be limited to the chromatographic method but also extended to other parameters (e.g., sample preparation) that might impact the final result. A solution containing the relevant analytes at the relevant concentrations will be injected with a series of modifications compared to the described method. The choice of these deliberate variations is specific to the type of method and should be based on scientific judgment. Typical variations related to analytical procedures are stability of analytical solution, extraction time, filter paper variation [42].

Figure 3: Identification of method validation parameters from the curve
Stability of Analytical Solution
For standard solution
Determine the system suitability criteria (wherever applicable) of standard preparation/system suitability preparation/ relative changes of % correlation after each suitable time interval (e.g., 0 h, 24 h, 48 h or as per the requirements) and report along with new standard preparation, system suitability preparation and % correlation [43].
For sample solution
Determine the assay (for assay, content uniformity etc.) or impurities (for related substances) or rate of dissolution (for dissolution testing) of sample solution after each suitable time interval (e.g., 0 h, 24 h, 48 h or as per the requirements) and determine the change to the initial result over the specified period [44].
Depending on the outcome, a comment should be added to the analytical method stating the handling instructions and the duration the solutions remain stable. Light-sensitive substances should be stored under the exclusion of light. In this case, the analytical method must contain corresponding instructions. Similarly, a refrigerated auto-sampler may have to be specified in the analytical method for temperature- sensitive substances [45].
Extraction time
For an analytical procedure in which the extraction of the analytes from the matrix (especially for drug product) is critical for the method performance, a separate robustness study should be done for the sample preparation step (e.g., by studying different extraction volumes, extraction times, solvent composition. etc.) [46].
Filter paper variation
The objective I s to demonstrate that the sample filtration does not affect the analytical result due to efficiency, leachability and adsorption. The following procedure may be used:
Efficiency of filter paper: Aliquots should be filtered through the filter paper mentioned in the method of analysis and compared with centrifuged sample aliquots to check for any interference of undissolved particles [47].
Leachability of filter paper: Blank/diluent or medium should be filtered through the filter paper mentioned in the method of analysis, and the filtered should be compared with unfiltered blank/diluent or medium to check that there is no leaching/interference of mentioned filter paper.
Adsorption of filter paper: An aliquot of the obtained solution or slurry is centrifuged; further aliquots are sequentially filtered through the same filter (e.g., collect the aliquots after discarding first 2 mL of the filtrate flowed by 4 mL, 5 mL etc.), and the results are compared [48].
Typical variations related to liquid chromatography: Perform system suitability, test preparation and spiked test preparations (wherever applicable) under normal and by changing slight variations in the LC method parameters like the influence of variations of pH in a mobile phase, the influence of variations in a minor component in a mobile phase, the influence of different columns (different lots or suppliers), the influence of column oven temperature, the influence of flow rate, the influence of wavelength, the influence of buffer and salt concentration [49,50].
Typical variations related to gas chromatography: Perform system suitability, test preparation and spiked test preparations (wherever applicable) under normal and by changing small variations in the GC method parameters like the influence of different columns (different lots or suppliers), the influence of column oven temperature, the influence of flow rate/pressure, the influence of HS vial agitation, the influence of HS vial equilibration time, the influence of HS oven temperature [51].
Typical variations related to dissolution methods: Dissolution tests should be performed under normal and by changing small variations in the dissolution parameters. Examples are the strength of the dissolution medium, RPM, medium volume, the dissolution medium’s pH, and the dissolution medium’s temperature [52].
Typical variations related to spectroscopic methods: UV-Vis spectroscopy (Wavelength, Comparison with other techniques UV vs LC etc.) and IR spectroscopy (Number of scans, Comparison with other techniques, e.g. ATR vs KBR etc.). Typical variations related to titrimetric methods/water by KF methods: Sample weight and strength of titrant [53].
The evaluation of robustness should be considered during the validation study. It should reflect the reliability of analysis to deliberate variations in method parameters. One consequence of the evaluation of robustness should be that a series of system suitability parameters are established to ensure that the validity of the analytical procedure is maintained whenever used [54]. If the method is sensitive to one of these parameters, this should be explicitly stated in the written method. In this case, it may be appropriate to investigate narrower ranges of variations to specify the operating conditions in the method. Typical chromatograms should be displayed [55].
Analytical Method Verification
Procedures described in pharmacopeias do not have to be validated. Still, it has to be verified (compendia verification) that they are suitable under actual conditions of use regarding their testing performance characteristics, e.g., specificity, intermediate precision or stability of the solution [56]. The exact degree/extent of verification depends on the level of training and experience of the persons intended to use the method, the type of procedure and its associated equipment and instrumentation, the specific procedural steps and on which product is being tested [57,58]. The rationale for the chosen degree/extent and the verification result should be documented [59]. Verification is optional for basic compendial test procedures, e.g., pH measurements or residue on ignition that are routinely performed unless there is an indication that the compendial procedure is not appropriate for the product to be tested [60].
Conclusion
The efficient development and validation of analytical methods are critical elements in developing pharmaceuticals and ensuring regulatory compliance. Analytical method validation is an essential tool for ensuring the method’s performance. Various guidelines by different regulatory bodies and organizations disagree on different points. Though ICH guidelines have resolved the differences between Europe, the USA and Japan, organizations like IUPAC and AOAC still have differences on some points. There should be an effort to put forward uniform guidelines for validation worldwide and to create a similar platform for acceptance criteria.
Acknowledgement
None.
Conflict Of Interest
Authors have no conflict of interest to declare.
References
- G. Lavanya, M. Sunil, M.M. Eswarudu, M.C. Eswaraiah, K. Harisudha, et al. Analytical method validation: An updated review, Int J Pharm Sci Res, 4(2013):1280-1286.
- M.D. Alamshoaib, Pharmaceutical process validation: An overview, J Adv Pharm Edu Res, 2(2012):185-200.
- P. Ravisankar, S. Gowthami, G.D. Rao, A review on analytical method development, Indian J Res Pharm Biotech, 2(2014):1183.
- J. Mendham, R.C. Denny, J.D. Barns, Vogel's text book of quantitative chemical analysis, 6th Ed, 289(2001):297-305.
- P. Ravisankar, S. Gowthami, G. Devlala Rao, A review on analytical method development, Indian J Pharm Sci, 2(2014):1183-1195.
- A. Chauhan, B. Mittu, P. Chauhan, Analytical method development and validation: A concise review, J Anal Bioanal Tech, 6(2015):1-5.
- G.P. Carr, J.C. Wahlich, A practical approach to method validation in pharmaceutical analysis, J Pharm Biomed Anal, 8(1990):8-12.
- H.H. Willard, L.L. Merrit, Instrumental methods of analysis, CBS Publishers, 7(1986):921-999.
- P. Ravisankar, C.N. Navya, D. Pravallika, D.N. Sri, A review on step-by-step analytical method validation, IOSR J Pharm, 5(2015):7-19.
- S.K. Bhardwaj, K. Dwivedi, D.D. Agarwal, A review: HPLC method development and validation, Int J Anal Bioanal Chem, 5(2015):76-81.
- M.M. Varma, A. Thulluru, K.T.S. Kumar, G.S. Kumar, K. Pavani. HPLC method development and validation: A review, Int Res J Pharm, 10 (2021):405-426.
- R. Pathuri, M. Muthukumaran, B. Krishnamoorthy, A. Nishat, A review on analytical method development and validation of the pharmaceutical technology, Curr Pharm Res, 3(2013):855-870.
- R. Malviya, V. Bansal, O.P. Pal, P.K. Sharma, High performance liquid chromatography: A short review, J Glob Pharma Technol, 2(2010):22-26.
- Y. Vidushi, B. Meenakshi, A review on HPLC method development and validation, Res J Life Sci, 2(2017):178.
- J. Breaux, K. Jones, P. Boulas, Development services analytical method development and validation, Pharm Technol, 27(2003):6-13.
- G. Kour, S. Daksh, A review on step by step analytical method validation, World J Pharm Life Sci, 4(2018):39-48.
- G. Ngwa, Forced degradation as an integral part of HPLC stability-indicating method development, Drug Deliv Technol, 10(2010):56-59.
- E. Jatto, A.O. Okhamafe, An overview of pharmaceutical validation and process controls in drug development, Trop J Pharm Res, 1(2002):115-122.
- M.K. Mishra, P. Kumari, A review on pharmaceutical process validation, J Pharm Innov, 8(2019):950-958.
- L. Nandhakumar, G. Dharmamoorthy, S. Rameshkumar, S. Chandrasekaran, An overview of pharmaceutical validation: Quality assurance viewpoint, Int J Res Pharm Chem, 1(2011):1003-1014.
- S. Deshmukh, G. Chavan, S. Vanjari, R. Patil, A review on analytical method development and validation by high performance liquid chromatography technique, J Pharm Sci Res, 11(2019):3599-3605.
- K.A. Gudadhe, M.G. Tawar, Development and validation of analytical instrumental method for pharmaceutical products, Am J Pharm Health Res, 7(2019):1-19.
- V.S. Sawale, D. Umaheshwari, A review on novel analytical techniques used in method development and validation of pharmaceuticals, J Pharm Sci Res, 12(2020):321-328.
- The United States Pharmacopeia 41, National formulary 36, System suitability, USP, Rockville, 2018.
- R.K. Srivastava, S.S. Kumar, An updated review: Analytical method validation, Eur J Pharm Med Res, 4(2017):774-784.
- ICH harmonised tripartite guideline, validation of analytical procedures: Text and methodology, Q2 (R1) November, 2005.
- S. Daksh, A. Goyal, C.K. Pandiya, Validation of analytical methodsâ??strategy and significance, Int J Res Dev Pharm Life Sci, 4(2015):1489-1497.
- M. Blessy, D.R. Patel, P.N. Prajapati, Y.K. Agarwal, Development of forced degradation and stability indicating studies of drugs: A review, J Pharm Anal, 4(2014):159â??165.
- V. Singhote, S.D. Mankar, S.B. Dighe, A review article on analytical methods development and validation, Res J Science Tech, 14(2022):77-83.
- H. Bhenjaliya, R. Barse, Analytical method development and validation: Requirements in pharmaceutical field, MJPS, 6(2020):60-65.
- P. Ravisankar, A. Pentayala, C.B. Sai, P. Hemasari, P.S. Babu, Validation characteristic and statistics in analytical method development, High Technol Lett, 27(2021):76-88.
- S. Gupta, P. Verma, A.P. Mishra, N. Omar, R. Mathur, A review on novel analytical method development and validation by RP-HPLC method, Ind J of Forens Medcn Toxico, 15(2021):3476-3486.
- S. Sharma, S. Goyal, K. Chauhan, A review on analytical method development and validation, 10(2018):8-15.
- N. Thakur, A. Kumar, A. Chaudhary, A. Chaudhary, A review on spectroscopic analytical method validation and force degradation study, IJRAR, 7(2020):942-953.
- S.T. Patil, R.A. Aherrao, S.P. Pawar, A short review on method validation, JPBS, 5(2017):30-37.
[Crossref]
- R. Rina, M. Baile, A. Jain, A review: Analytical method development and validation, Sys Rev Pharm, 12(2021):450-454.
- S. Shrivastava, P. Deshpande, S.J. Daharwal, Key aspects of analytical method development and validation, JRUB, 31(2018):32-39.
- M. Doltade, R. Saudagar, Analytical method development and validation: A review, JDDT, 9(2019):563-570.
- G. Geetha, K.N.G. Raju, B.V. Kumar, M.G. Raja, Analytical method validation: An updated review, IJAPBC, 1(2012):64-71.
- The United States Pharmacopeia 41, National formulary 36, Transfer of analytical procedures, USP, Rockville, 2018.
- B. Lal, D. Kapoor, M. Jamini, A review on analytical method validation and its regulatory perspectives, JDDT, 9(2019):501-506.
- R.N. Kachave, K.P. Jadhav, Analytical method development and validation: A review, IJCRT, 9(2021):554-570.
- The United States Pharmacopeia 41, National formulary 36, The dissolution procedure: Development and validation, USP, Rockville, 2018.
- The United States Pharmacopeia 41, National formulary 36, Validation of compendial methods, USP, Rockville, 2018.
- G. Chawla, K.K. Chaudhary, A review of HPLC technique covering its pharmaceutical, environmental, forensic, clinical and other applications, Int J Pharm Chem Anal, 6(2019):27-39.
- P. Ravisankar, C.N. Navya, D. Pravallika, D.N. Sri, A review on step-by-step analytical method validation, IOSR J Pharm, 5(2015):7-19.
- S. Chakraborty, S. Mondal, A green eco-friendly analytical method development, validation, and stress degradation studies of favipiravir in bulk and different tablet dosages form by UV-spectrophotometric and RP-HPLC methods with their comparison by using ANOVA and in-vitro dissolution studies, Int J Pharm Investigation, 13(2023):290-305.
- P.T. Kissinger, Instant notes: Analytical chemistry, Clin Chem, 48(2002):2303.
- M. Ghosh, S. Mondal, S. Chakraborty, N. Ghosh, A stability indicating method was developed and validation for the estimation of carbamazepine in bulk and tablet dosage form by UV-spectroscopic techniques, JDDT, 13(2023):85-104.
- S.G. Musharraf, U. Fatima, R. Sultanan, Stress degradation studies and development of stability indicating-TLC densitometry method for determination of predensolone and chloramphenicol in their individual and combined pharmaceutical formulations reversed phase, Chem Central J, 6(2012):134-137.
- S. Chakraborty, S. Mondal, A systematic and concise review on the development of analytical and bioanalytical methods for the simultaneous estimation of abacavir sulfate and lamivudine, YMER, 21(2022): 912-935.
- N.N.E.A. Salama, A.O. Mohamed, Stability-indicating methods for the determination of sertaconazole nitrate by micelle-enhanced spectrofluorimetry and TLC-densitometry, Bull Chem Soc Ethiop, 23(2009):167-174.
- B. Ramakrishna, S. Mondal, S. Chakraborty, Development and validation of novel method for the determination of favipiravir and peramivir using reverse phase ultra-performance liquid chromatography, YMER, 21(2022):1618-1632.
- A. Shafaati, B. J. Clark, Drug and tablet preparation by capillary electrophoresis, Drug Dev Ind Pharm, 26(2000):267-273.
- S.L. Maneka, R.T.S. Kumar, A. Male, Stability-indicating method development and validation for simultaneous estimation of ombitasvir, paritaprevir, and ritonavir in formulation by ultra-performance liquid chromatography, IJPSDR, 12(2022):457-463.
- A. Mohammadi, S. Nojavan, M. Rouini, A.R. Falchari, Stability evaluation of tramadol enantiomers using a chiral stability-indicating capillary electrophoresis methods and its application to pharmaceutical analysis, J Sep Sci, 34(2011):1613-1620.
- M. Ghosh, S. Mondal, S. Chakraborty, N. Ghosh, A new stability indicating method development and validation report for the assay of nivolumab by RP-UPLC, J Pharm Negat Results, 13(2023):85-104.
- A.F. Galvao, T.O. Ajimura, F.A. Aguiar, K.B. Borges, C.M.D. Gaitan, Stability indicating methods for the enantio selective determination of dihydropyridines by HPLC and capillary electrophoresis, Analytical Methods, 4(2012):2953-2961.
- K.J. Sai, S. Mondal, S. Chakraborty, B.N. Revu, Sensitive and economical different spectroscopic methods development and validation for the quantification of capecitabine and stress degradation studies, Int J App Pharm, 15(2023):90-99.
[Crossref]
- J.R. Sharp, The problems of process validation, Pharm J, 1(1986):43-45.
Copyright: © 2023 Sandip Kumar Dey, et al. This is an open access article distributed under the terms of the Creative Commons Attribution License, which permits unrestricted use, distribution, and reproduction in any medium, provided the original work is properly cited.